USDCAD 29/11/18
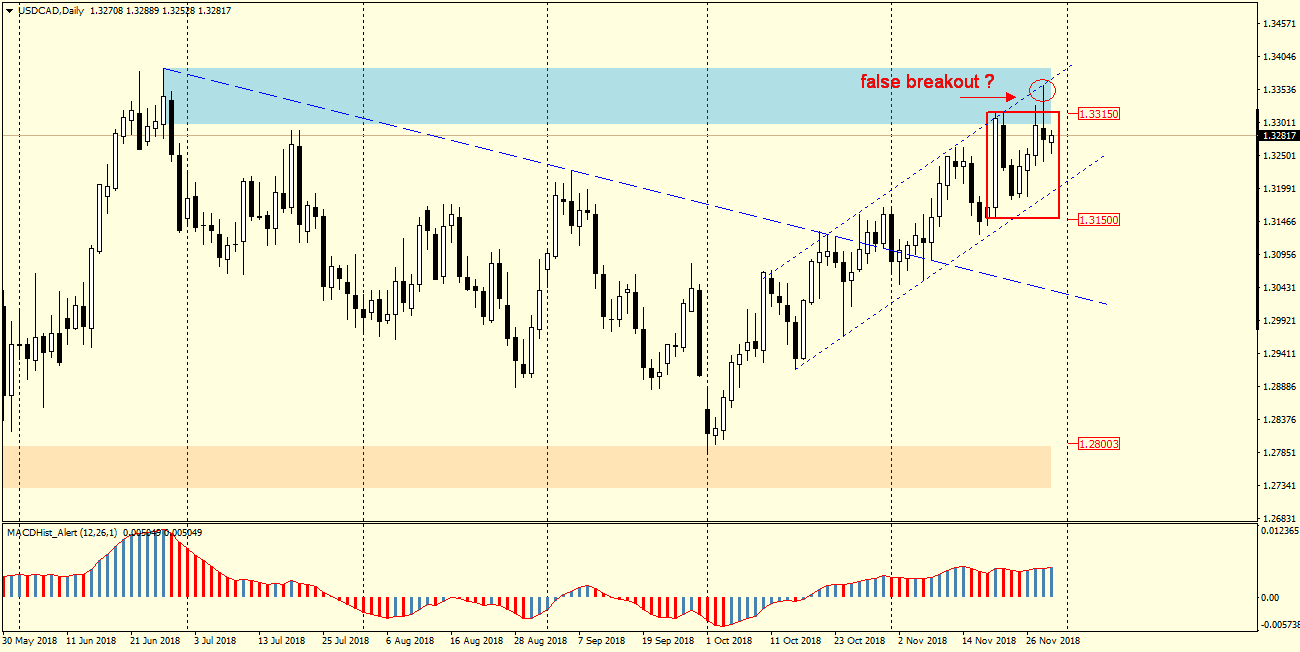
USDCAD – The situation on this pair was described in the Monday analysis. The Inside Bar there described, which was created by the candle from November 20, was broken thru the top yesterday, but the quotations suddenly returned to the IB after Powell’s (FED) statement suggesting a possible halt in US interest rate hikes.
In the above graph D1, it looks like a fake breakout.

When we look at the H4 chart, we notice that yesterday’s price stopped just before the resistance of the growth channel in which the pair moves from the beginning of October. The upper and lower IB limit will still be the decision levels. Overcoming one of them should ultimately point the direction for this pair for the next few sessions. Since there is a bearish divergence on H4, I am inclined towards the southern direction. The graph shows the closest demand zones that may become the target for supply.
 Join our Facebook group for more analyses and educational content:
https://www.facebook.com/groups/328412937935363/


 Review")


