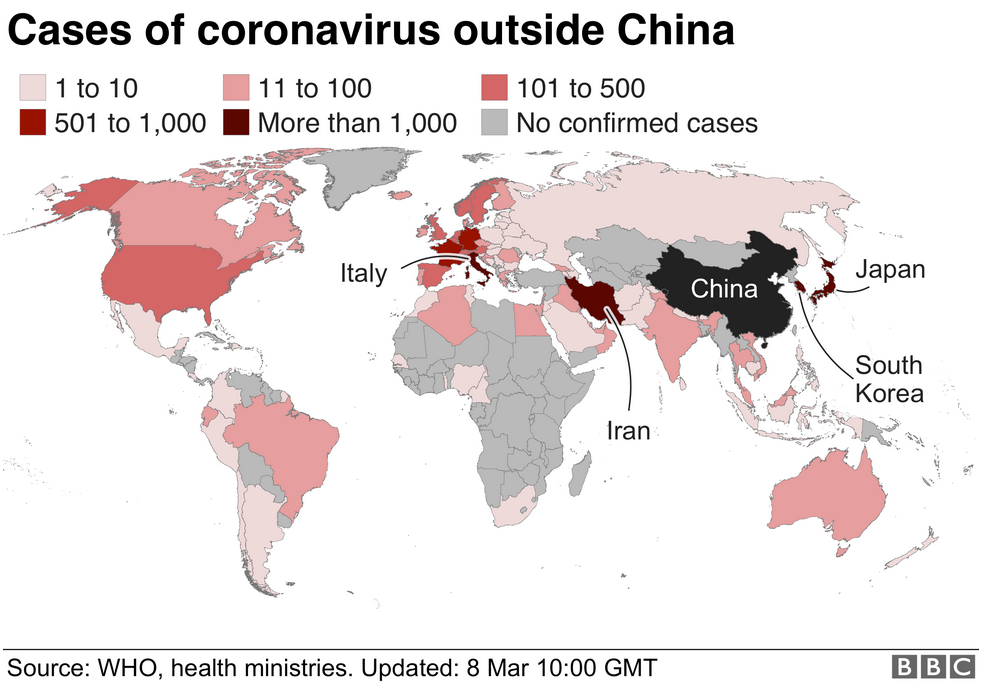
The event of the past week was undoubtedly a 50pb interest rate cut by the FED. This decision was surprising because it was taken two weeks before the scheduled for 18.03 FED meeting. Such an extraordinary intervention last happened in 2008. The reason for such a move is of course the coronovirus and its confirmed presence in the USA. Restrictions on the movement of citizens in quarantined areas have an obvious impact on the state of the economy of these countries.

Transport, tourism and several other indirectly related industries are suffering huge losses. The airlines are threatened with bankruptcy due to passenger shortages, there are less road transport orders, orders for sea transport from Asia are only 30% of normal tonnage. The mining industry, especially fuels such as oil and coal, is experiencing a drop in demand, so prices are also falling, oil at just 41.50 per barrel.
The financial markets have it in common to expect the unexpected… so was it possible to predict what the FED would do? I don’t think so… All we have to do is analyze the market according to our strategy and hope that the market will “digest” the unexpected news and return to the AT target.
From Monday to Friday – Live trading at 13:00 (London time) chat, analyse and trade with me: https://www.xm.com/live-player/basic
Last week I analysed two pairs and despite such a surprising event as the FED prepared for us, both analyses worked quite well.
USDJPY 03-07.03.2020

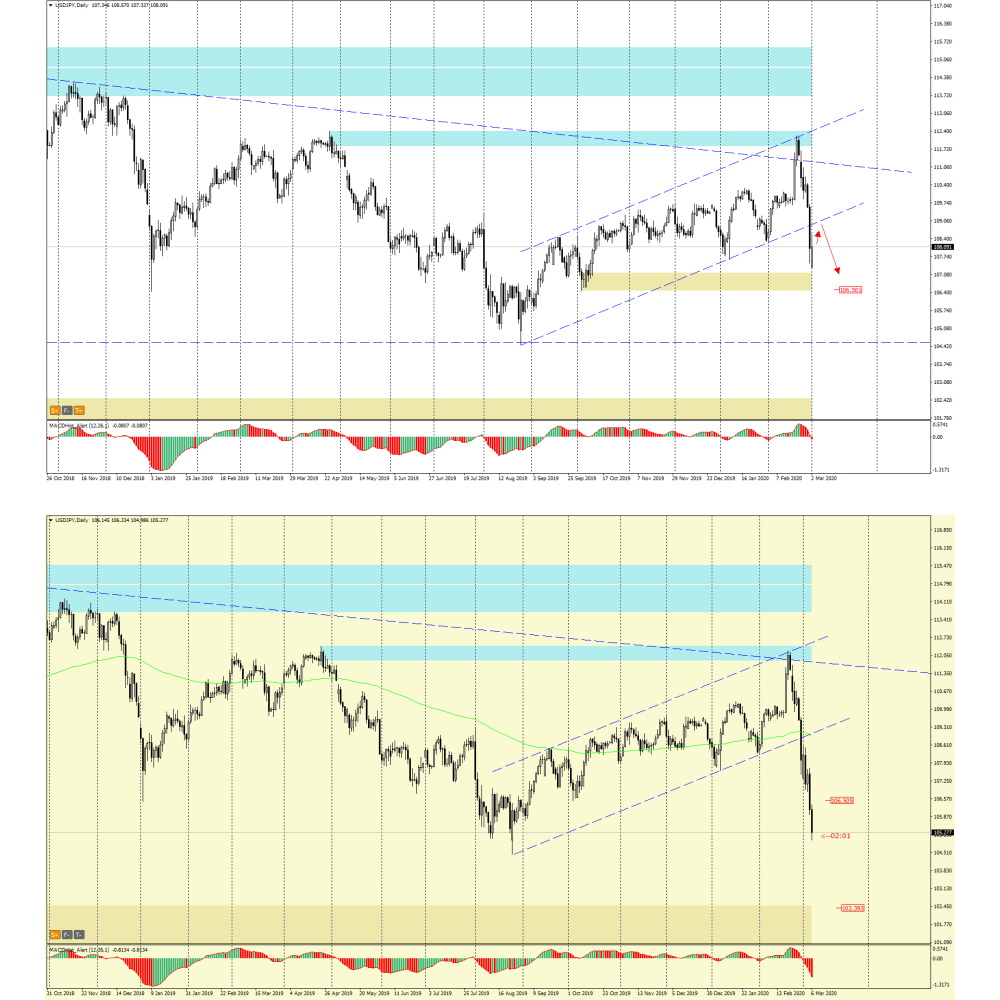
In my analysis of Monday’s “USDJPY – Bearish engulfing on monthly chart”, I noticed a bearish pattern : “When we look at the USDJPY pair’s daily chart, we can see that the price after a false break out from the triangle (from the monthly chart) on the last day of February broke down from the channel from the daily chart.
In the near future, we can expect a re-test of the defeated support of the channel, which will now become a resistance for the growth correction and is located near level 109. After the re-test, the pair may return to declines, and the supply goal will be the demand zone (brown) at 107.10-106.50.”
The reality turned out to be more “bearish” as the price of the pair reached 105.00, which was undoubtedly due to the FED decision. There is a possibility of falls towards the next important S/R level, which is around 104.40.
AUDUSD 04-07.03.2020

In the case of this pair, analysis: “AUDUSD – antipode reactivation ?” I wrote after the FED decision. Here appeared a inside bar formation, from which the price already broke out thru the top.
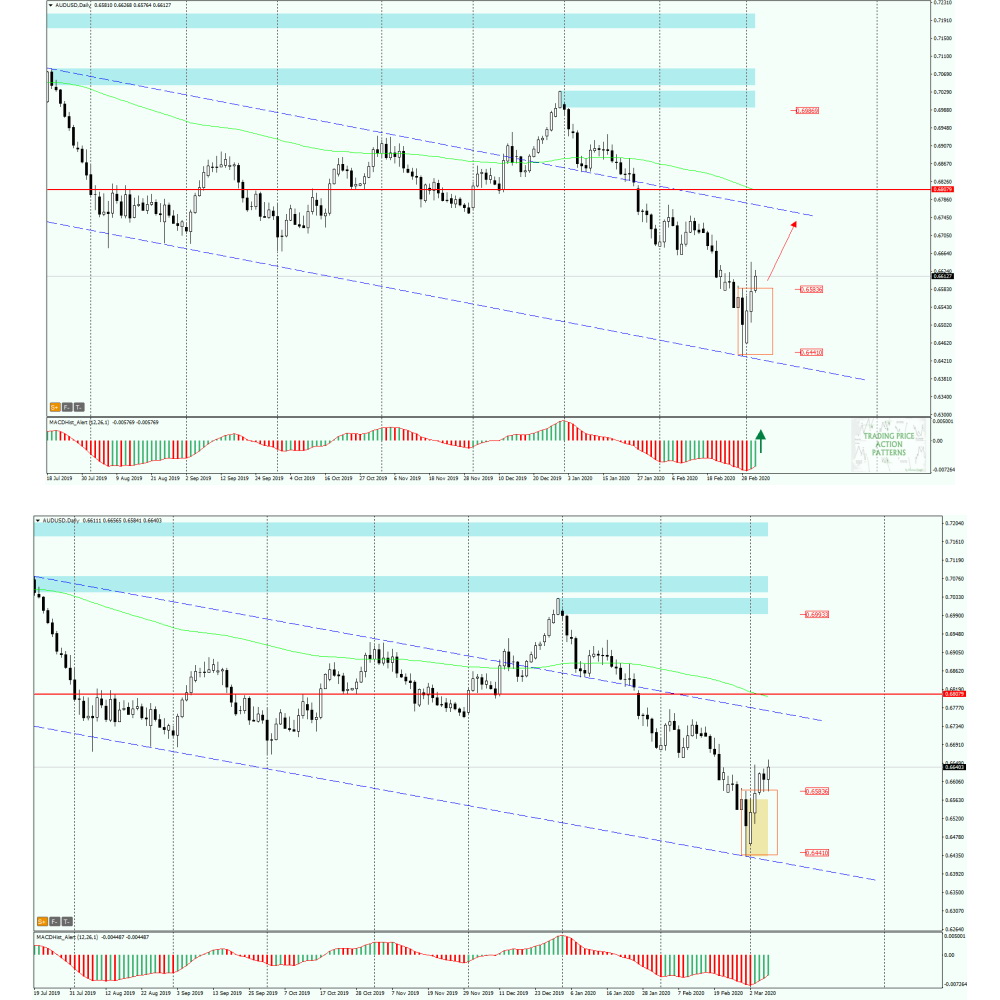
I wrote this: “On the daily chart we can see the Inside Bar candlestick pattern. It was formed by the last candle of February with the first candle of March. Today, the price has broken out of the pattern, this is accompanied by an ascending MACD , and there is a high probability of continued increases towards the resistance of the channel, which is currently around 0.6750 .”
Analyzing the current graph of this pair we see that the upper limit of the inside bar is currently supporting the pair and Friday’s candle clearly indicates further increases. The resistance of the channel can still be targeted by the demand ( dashed blue line).
In our Facebook group, which you can join anytime: https://www.facebook.com/groups/328412937935363/ you will find 5 simple strategies on which my trading is based. There, every day we post fresh analyses of currency pairs and commodities


