Monthly S&P500 Emini futures candlestick chart: Bulls need follow-through in November

The monthly S&P500 Emini futures candlestick chart rallied strongly in October and reversed almost all of the August selloff. There was a 20 gap bar buy signal at the moving average in August (the 1st pullback to the moving average in 20 or more months), but the buy signal bar was weak (September was the buy signal bar and it was only a doji bar instead of a bull reversal bar). The odds favored sellers above the September high and more of a trading range. Instead, there were strong buyers.
The bears might sell in November and negate the October bullishness. If they do sell, they would probably only extend the 3 month trading range instead creating a bear trend. When a market has not pulled back to the moving average in 38 months, as was the case with the Emini, the first reversal attempt is usually minor, which means that a trading range or bull flag is more likely than a bear trend.
The bulls see this October’s low as a double bottom bull flag with the October 2014 low. They want a breakout to a new high and then a measured move up. Since the year long range is about 300 points tall, the bulls are looking for a rally to around 2400 before there is a significant correction.
Thirty-eight months above the moving average is extreme. This means that the correction will probably last more than 3 months and that any breakout to a new all-time high will probably be small and brief.
The bears want the October rally to fail around the current level and form a double top with the September all-time high. They then want a breakout below the neckline of the double top, which was the October low. If they get that, they want a measured move down, which would be to around 1500. This would be below the March 2000 high, which was the breakout point for the current 6 year bull trend.
At the moment, both the bull and bear objectives are unlikely. It is more likely that any rally will be limited because the buy climax is still affecting the market. The bulls are exhausted. The buy climax will also limit the downside because it is a sign of extremely eager bulls. When the bulls are very strong, the best the bears usually get is a trading range and not a bear trend. With the upside and downside both limited, the result is probably a trading range, and it might last for many bars (months) before traders decide between trend resumption up and trend reversal down.
Weekly S&P500 Emini futures candlestick chart: Bulls will buy the 1st pullback
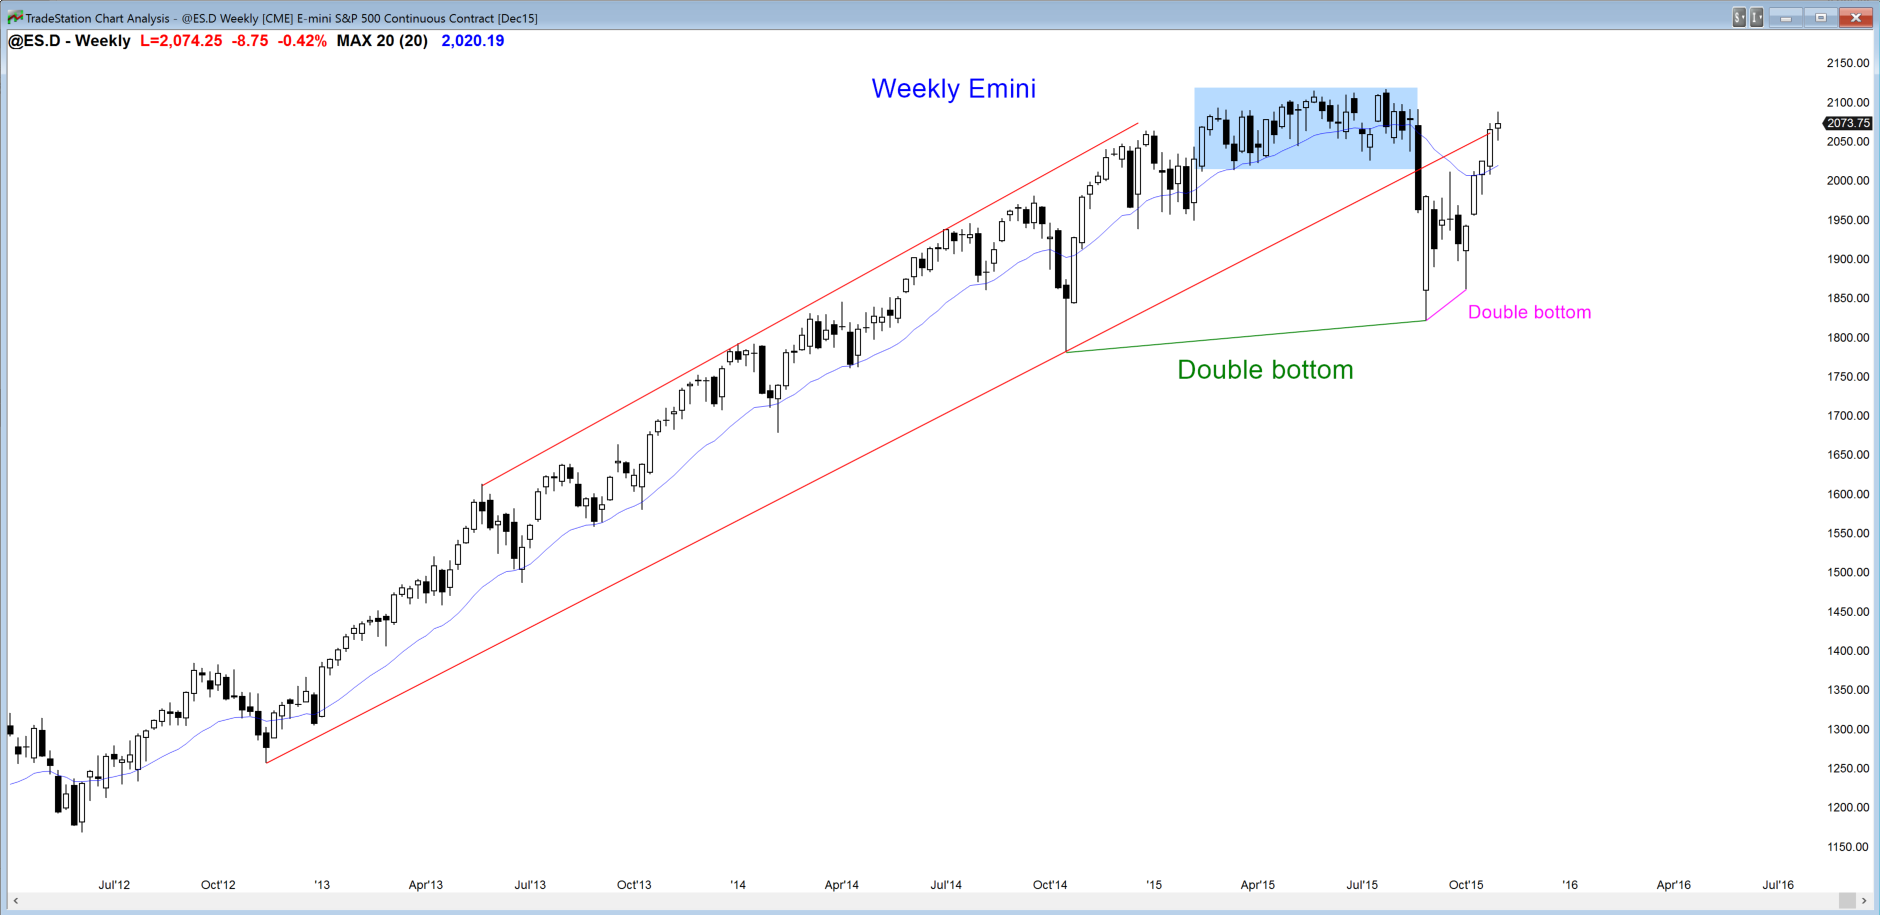
The weekly S&P500 Emini futures candlestick chart has rallied for 5 weeks and each close has been above the midpoint of the bar. This is strong buying. Although it might simply be a buy vacuum test of resistance (the August 17 top of the bear trend), it is strong enough so that the 1st reversal down will probably be bought. This means that the bears will probably need at least a micro double top before they can create much of a correction. Also, with the rally this strong, even if the bears create a small double top over the next few weeks, bulls will probably buy a 50% pullback and a pullback to the moving average. This means that the downside is limited for at least a month or two.
The bears hope that the Emini forms either a head and shoulder top, with the December rally being the left shoulder, or a double top with the all-time high. The selloff had 6 bars with highs below the moving average (moving average gap bars). There is a gap between the high of each bar and the moving average. When one or more gap bars form late in a bull trend, the rally that follows is usually the final rally before the bears create a major trend reversal. The current rally is so strong that the bears will need at least a few weeks to create selling pressure and a micro double top. Without that, most traders would not sell until they see a strong bear breakout with follow-through.
If the bears succeed in creating a major trend reversal, they will have a 40% chance of two legs down for a swing trade. Their initial target is the August low. If a credible major trend reversal forms, there is a 60% chance of a small profit or loss. Since all major tops are trading ranges and trading ranges resist change, 60% of tops fail. The trading range usually continues, but sometimes the failure results in a new leg up.
Daily S&P500 Emini futures candlestick chart: Traders learning how to trade should not buy a buy climax
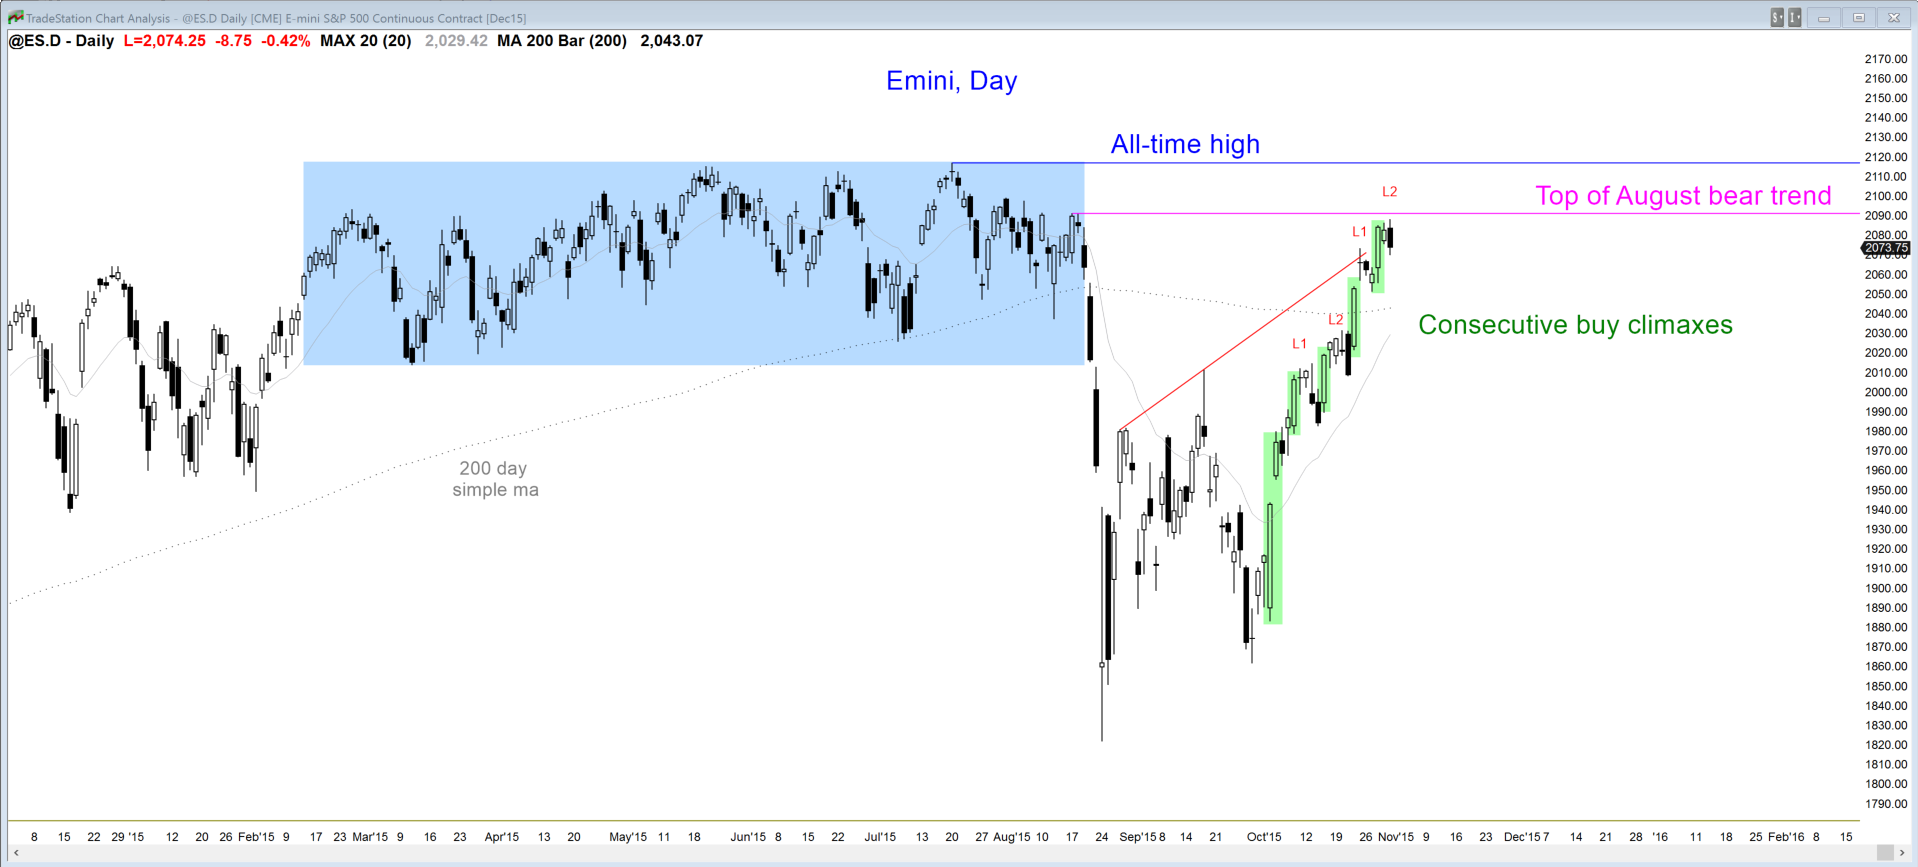
The daily S&P500 Emini futures candlestick chart had a strong rally in October. However, it contained 5 consecutive buy climaxes without much pulling back. This is extreme behavior and it has a 75% chance of a TBTL sideways to down correction starting within the next week or two. There is still a 25% chance of it continuing far above the all-time high, but most traders will be looking for a pullback whether or not it first goes above the August 17 top of the bear trend first. Targets for the bears are the moving average, the minor higher lows, the bottom of the 7 month trading range, the 2,000 round number, and the September high. There is also an interesting topping pattern on the daily chart.
The Globex chart went above the top of the August bear trend by 1 tick on Friday and reversed down. The day session chart came within a few points of the high, but not close enough for traders to be confident that the test is complete. The odds are that it will have to be tested again within the next couple of weeks before the bulls give up their hope of a new all-time high.
There is an interesting pattern on the daily chart. The bulls broke above the September high and twice tried to reverse down (October 13 and 21). This was a Low 2 top. They failed, and there was a big bull breakout on October 22 above that top. That was followed by two more attempts to reverse down (October 27 and today), creating another Low 2 top. Although there might be one more minor push up next week to a wedge top (a Low 3 top where October 23 was the 1st high and today was the 2nd), this is a 2nd consecutive topping pattern in a buy climax at major resistance. There is a 60% chance of at least a couple of legs sideways to down. This is a Low 4 top. If the 2nd top is a wedge, it would be a Low 5, which is just a variation of a Low 4.
Original post was published at Al Brooks Price Action Trading Blog. Check Brooks Trading Course and get The most comprehensive source of information on price action trading available!


 Review")


