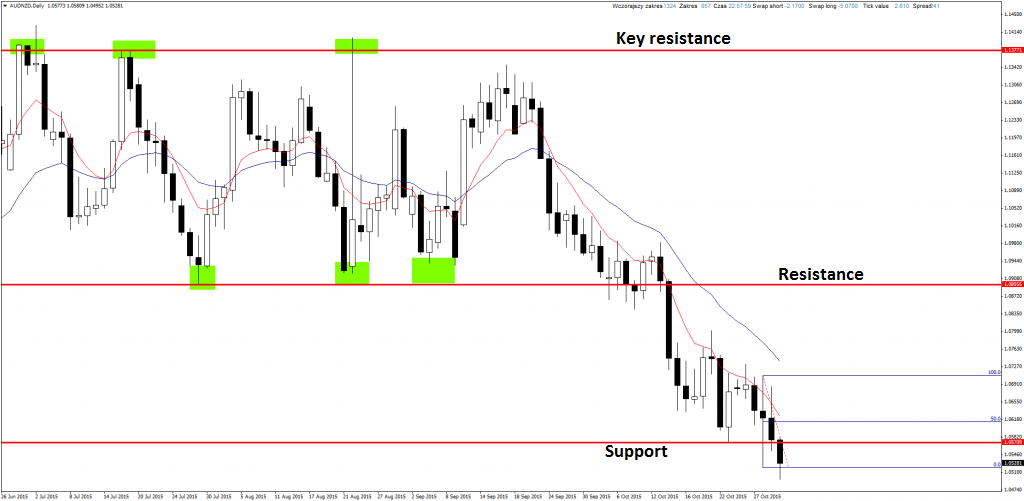
AUDNZD
On Friday pair broke support and closed below it. Here I made good decision and didn’t opened long position on Wednesday. Now we have to wait for bullish correction and enter short position after Price Action sell signal.
If you are interested in Price Action Strategy description, you can read it here.
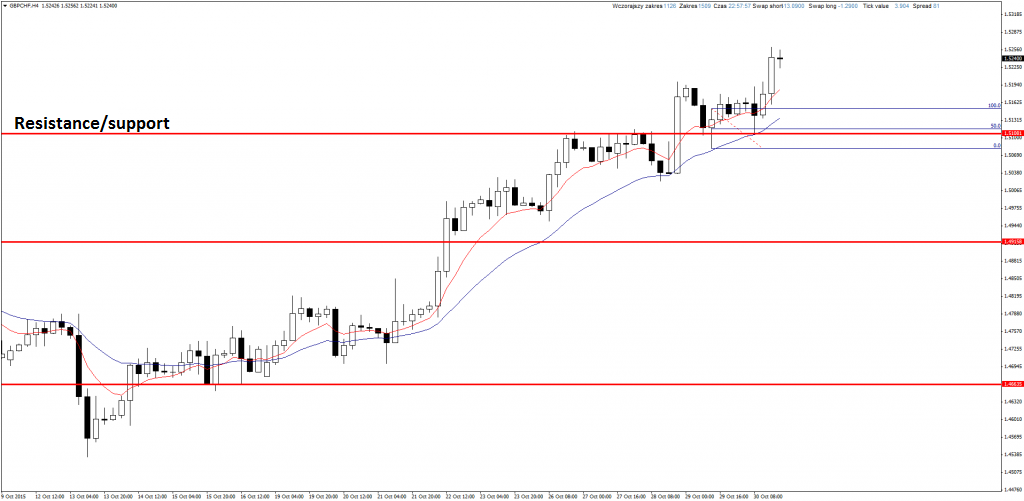
GBPCHF
On H4 chart there was buy signal in shape of Pin Bar, I set buy limit just above 50% retracement of this candle and it was activated. SL is 50 pips, TP is 220. Price already gained about 150 pips since I entered positon, so 50% of order is closed and the rest is secured at BE.
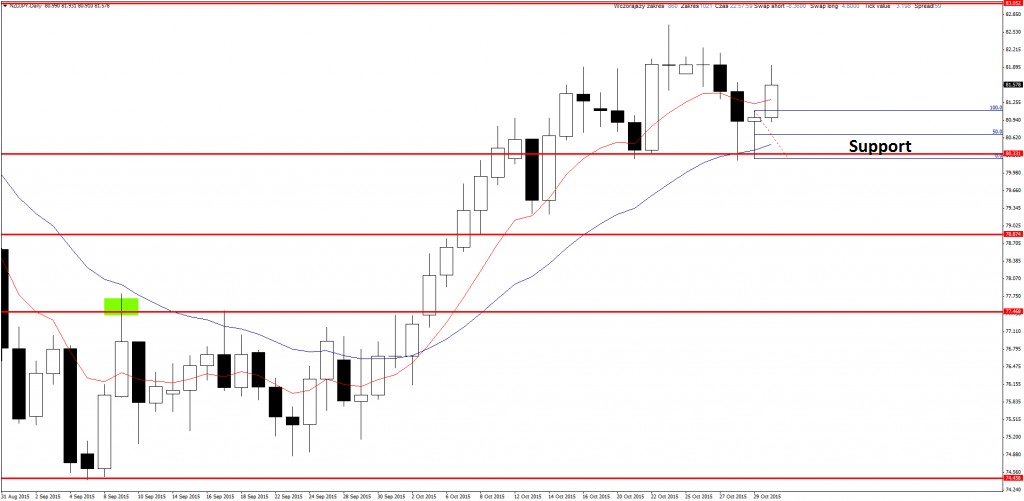
NZDJPY
Here I have still active long positon. If anyone didn’t opened it there is interesting signal on D1 chart. Clear Pin Bar, you can open long position on 50% retracement. Of course you have to find proper Stop Loss and Take Profit.
YOU CAN START USING PRICE ACTION AND INVEST ON FOREX MARKET USING FREE XM BROKER ACCOUNT.
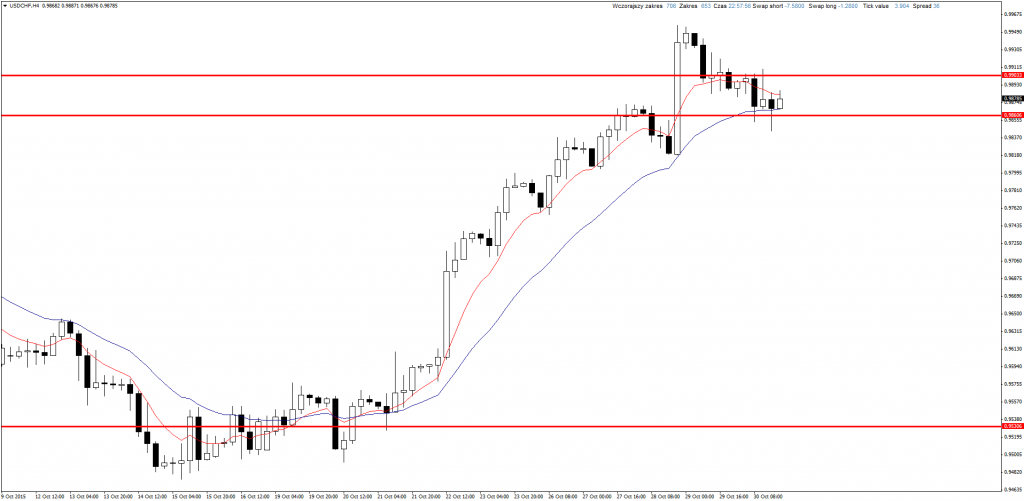
USDCHF
On this pair you can spot buy signal. It is one before last H4 candle. It is not perfect Pin Bar because it has bearish body but you can say it is a buy signal. SL is less than 30 pips and Take Profit over 200 pips so it is worth to consider.


 Review")


