Monthly S&P500 Emini futures candlestick chart: Breakout of small bull flag at the moving average
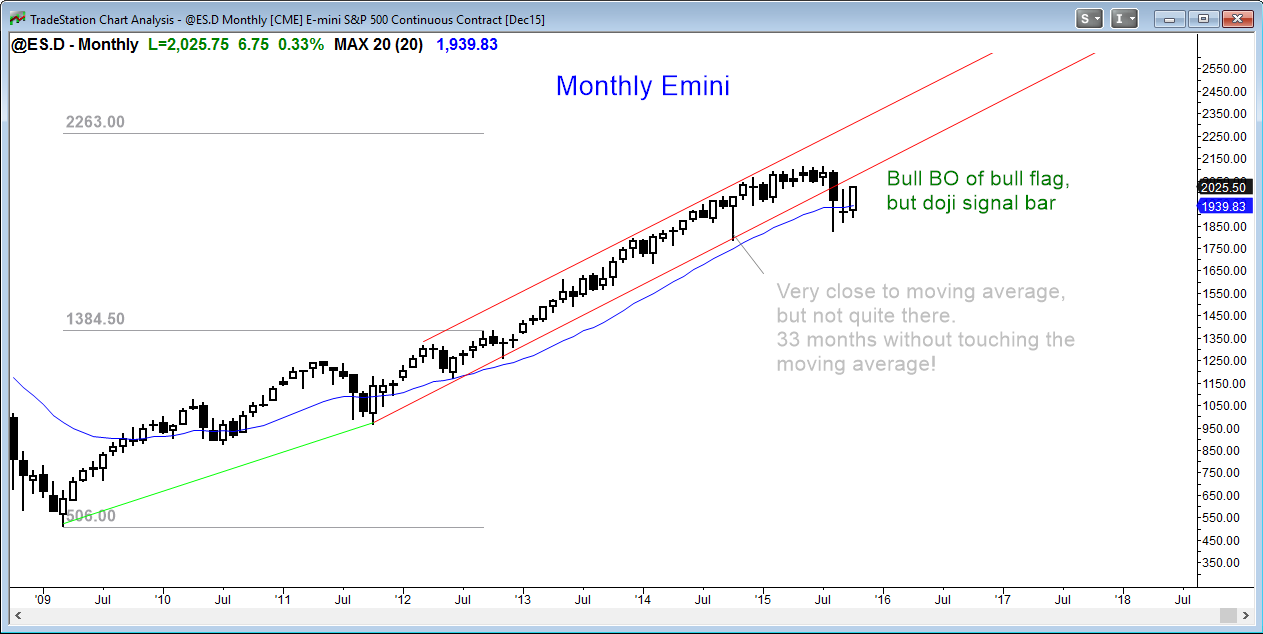
The bulls on the monthly S&P500 Emini futures candlestick chart are trying to totally reverse the August bear breakout. Because last month was a doji and therefore a weak signal bar, the odds are that the upside will be limited and the 3 month trading range will grow. If the bulls are able to create a big bull trend bar that closes on its high and well above last month’s high, they will then erase the neutrality of the weak buy signal bar.
Traders learning how to trade the markets should know that the odds would then favor a test the all-time high and a possible breakout. The bears obviously do not want this. They are unhappy with the developing reversal and need to make this bull entry bar become disappointing for the bulls. The only thing they can do is to prevent the month from closing on its high. The bigger the tail on top of the bar, the higher the probability that the rally this month is just a bar in a developing tight trading range.
Although it is possible for the month to totally reverse into a big bear trend bar in the 2nd half of the month, the chance of that is small. The best the bears can reasonably hope to do is to weaken the bull entry bar enough to make a trading range more likely than a new all-time high. At a minimum, they want the close to be below last month’s high. Next, they want it to be below the midpoint of the month, or even down at the moving average.
Because this month’s appearance affects the probabilities for the bulls for the next few months, the next two weeks are important. The final few days are the most important because they will determine whether there will be a tail on the top of the bar and how big that tail will be. The choice at the moment is between a resumption of the bull trend and the formation of a tight trading range. Those who trade the markets for a living are eager to see how this month ends.
Weekly S&P500 Emini futures candlestick chart: Follow-through after last week’s breakout
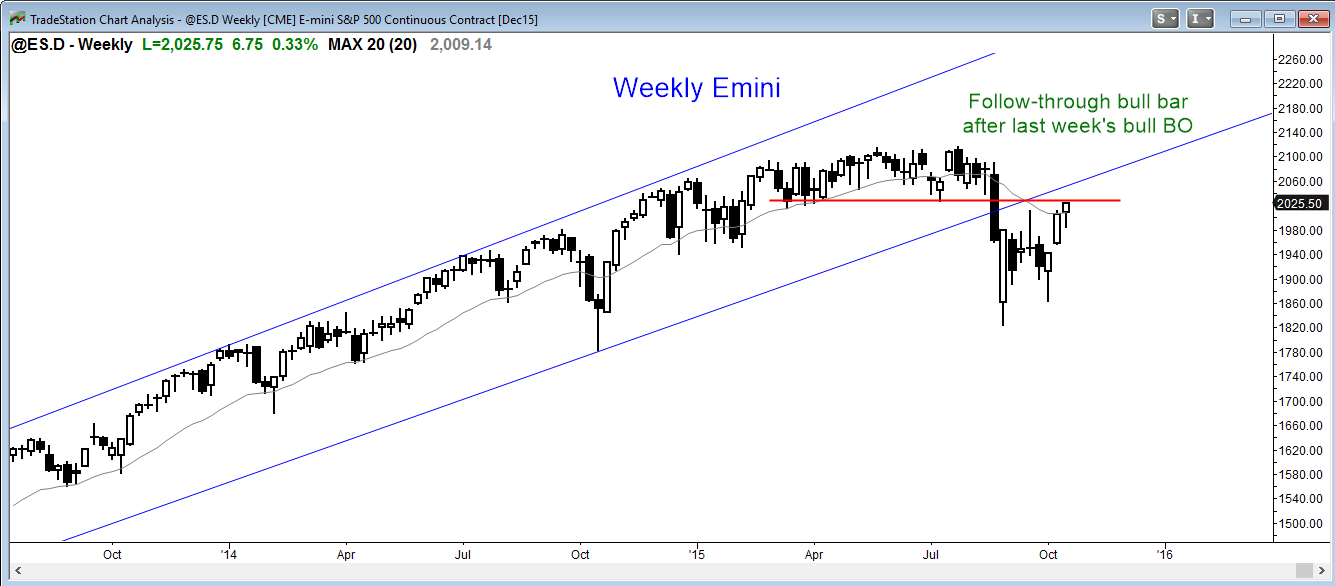
The weekly S&P500 Emini futures candlestick chart has had 3 consecutive bull trend bars closing on their highs in its reversal up from the double bottom with the August low. Two week ago, the Emini broke above the neck line of the double bottom. This past week was the follow-through bar, and it created a strong candlestick pattern. Even though the body was not big, a bull body this week was a sign that the bulls were able to confirm the bull breakout.
The bears need the breakout to fail. They had to create a bear body this past week. If they had, traders would have looked at the entire 8 week rally from the low as a big low 2 sell set up (an ABC bear flag). While it is still possible for them next week to create a big bear candle next week, the odds are less than 50%. The odds are more than 50% that there are bulls below last week’s low. This means that if this week sells off below last week’s low, instead of a big low 2 bear flag triggering and leading to a new low, it is more likely that bulls will overwhelm the bears and that the bear breakout will fail. This failure would then lead to at least 1 – 2 week’s more of higher prices. One to 2 weeks of higher prices are likely, whether or not the bears next week are able to trade below last week’s low.
Daily S&P500 Emini futures candlestick chart: Learn how to trade bull candlestick patterns
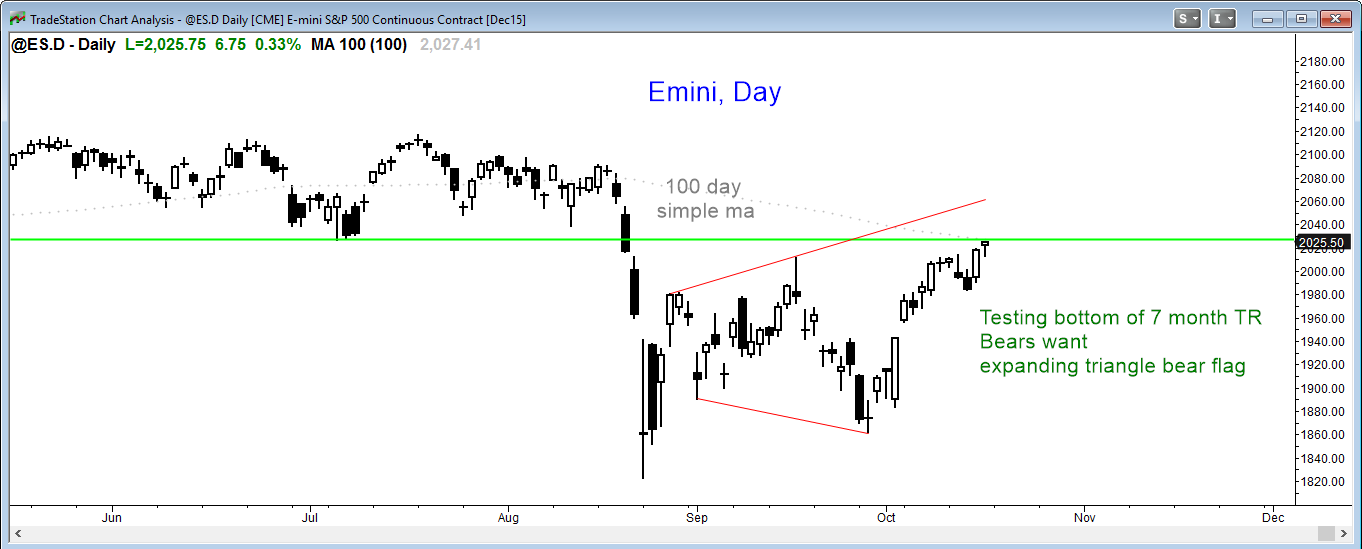
The daily S&P500 Emini futures candlestick chart is breaking above the two month trading range. The bulls need to get above the bottom of the trading range of the first 7 months of the year. There were several strong selloffs in that trading range, and different computers will use different lows as the resistance price. The Emini is already above the lowest point of the trading range. If it rallies above 2050, it will then have re-entered the trading range in everyone’s mind.
Look at the 10 days since the gap up. There were 3 big bull trend bars closing on their highs. What did the next day look like? Was it also a big bull candle? The three follow-through bars were a bear bar, a pair of dojis, and a small bull doji. This is weak follow-through and it increases the chances that this rally is a bull leg in a trading range rather than the resumption of the bull trend. I said a similar thing about the selloff down to the September 29 low. That many dojis made a bear leg in a trading range more likely that the resumption of the bear trend.
The past two days were good for the bulls, but they would have been better if Friday was a big bull trend day. If the bears are able to halt the rally somewhere around the bottom of the trading range (2050 or lower), they will begin to see an expanding triangle bear flag with the August 27 and September 17 high. If a decent sell signal bar develops in the next couple of weeks, especially if there is a 2nd entry sell (a small double top), this would be a reasonable short for a swing down to the bottom of the triangle at the August or September lows.
Like all major trend reversals, the probability of the swing down is only 40%, but the reward is several times greater than the risk. This more than offsets the low probability and creates a positive Trader’s Equation (a mathematically sound trade).
The reversal up has been strong enough to reduce the probability of the bears to about 50%. It is easy to look at this 3 week rally and conclude that the bulls have won. They have not. Do not look at a rally and ignore what is to the left. There is an unknowable number of bear dollars between the current price and the all-time high. If it turns out to be far greater than the bull dollars, the entire rally will end up being a lower high or a double top with the all-time high.
Until the bulls break strongly above the all-time high, the bears will have between a 40 and 50% chance of reversing the Emini back down to the bottom of the 3 month trading range. The rally has problems. It has not yet broken above the top of the bear leg, which began on August 17 or at the all-time high. The buy signal bar last month on the monthly chart was a doji, and it followed a bar with a big tail. This more often happens in a tight trading range than in a bull trend. The weekly chart still might be forming a big ABC bear flag (Low 2 sell setup). The follow-though after bull bars on the daily chart over the past 10 days is more like that in a bull leg in a trading range. Because of all of this, the probability that the rally will make a new all-time high is less than 60%. After Friday’s strong bull close, the probability is slightly more than 50%, but not much more.
The bulls need relentless follow-through buying over the next couple of weeks before traders will believe that the bulls are on their way to a new all-time high. If the bulls succeed in getting the high, they will look for a measured move up based on the height of the yearlong trading range. The range is about 300 points high, which means their target is above 2400.
Because the monthly chart had a buy climax (38 months above the moving average), it is more likely that a bull breakout to a new all-time high will fail, and that the yearlong trading range will be the final bull flag before a bigger correction unfolds. The target for the bears would be about TBTL (Ten Bars, Two Legs) on the monthly chart, and they would look for some type of measured move down, probably below 1700.
Original post was published at Al Brooks Price Action Trading Blog. Check Brooks Trading Course and get The most comprehensive source of information on price action trading available!


 Review")


