The AUDCHF has been moving this week above the key trend line running from the June 2016 low. However, in the week ending on August 10th, the course closed under the support i.e. trend line.
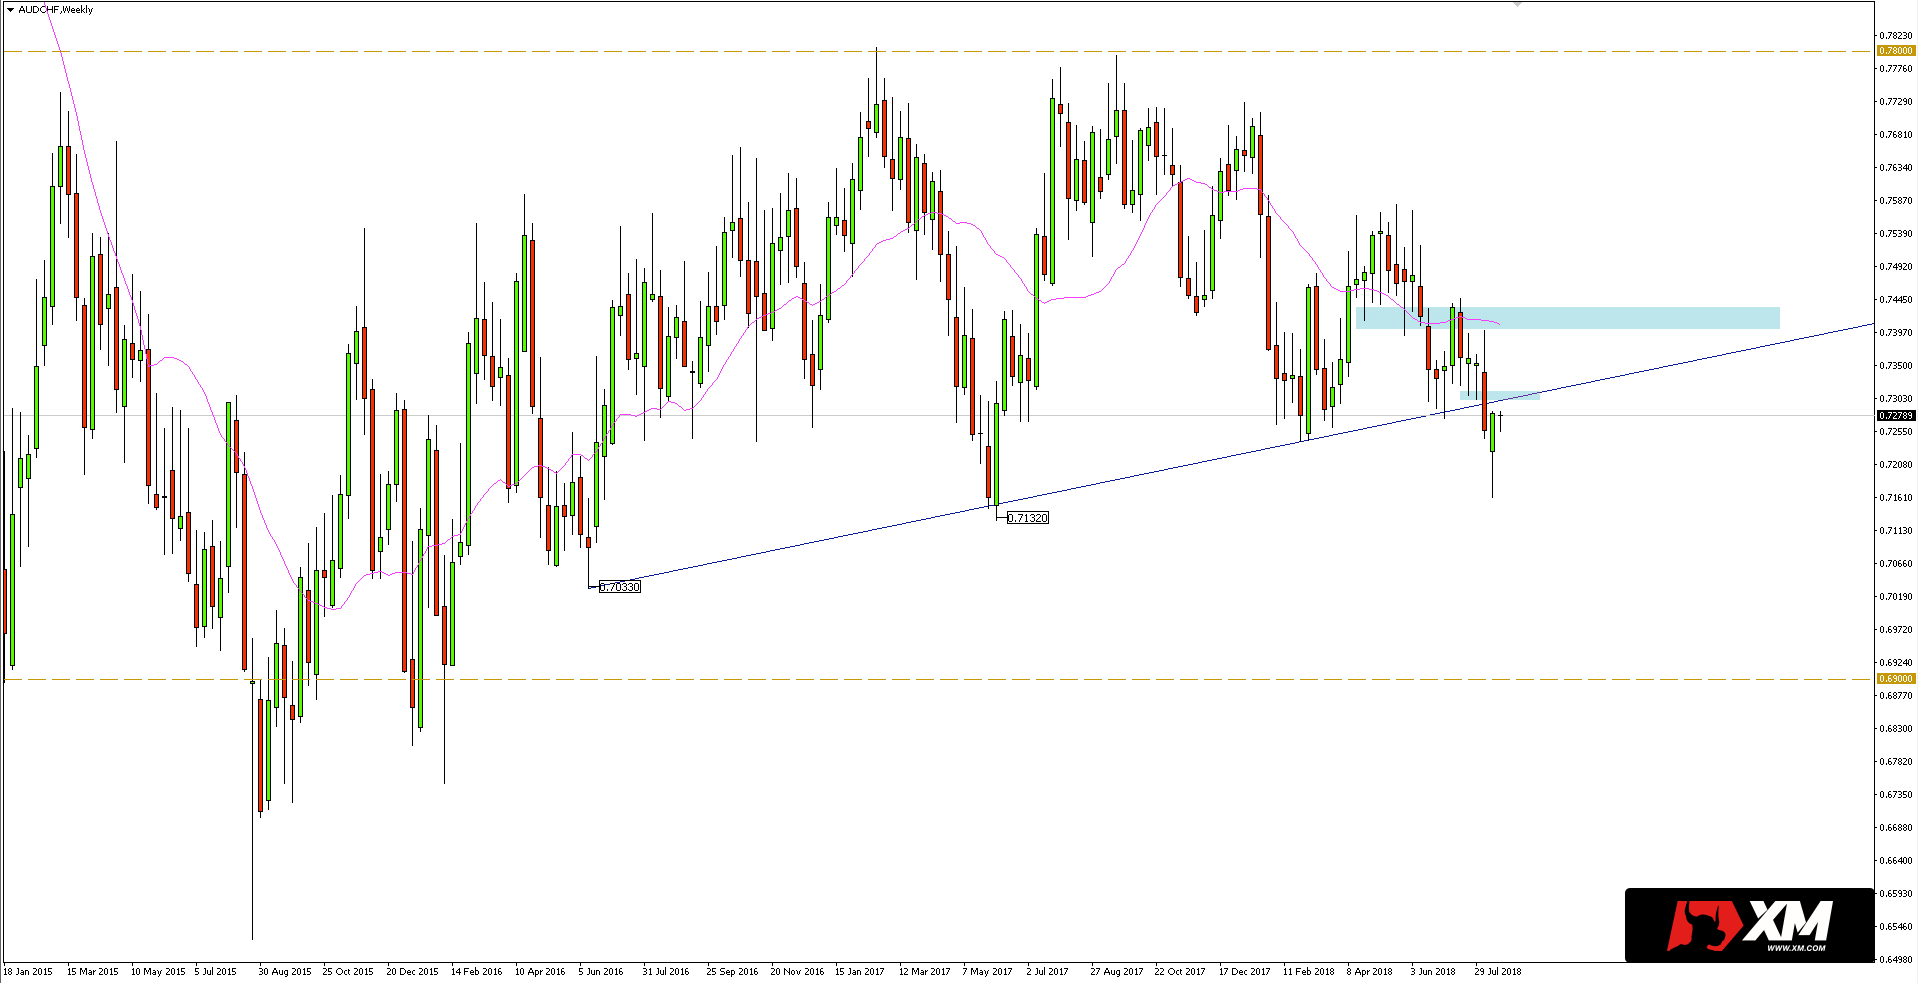 Last week, the declines were deepened, but until the end of the week, the entire losses were recovered. What’s more, Friday’s session closed around 500-pips higher than the opening.
I trade on this instrument at broker XM, which has in its offer more than 300 other assets >>
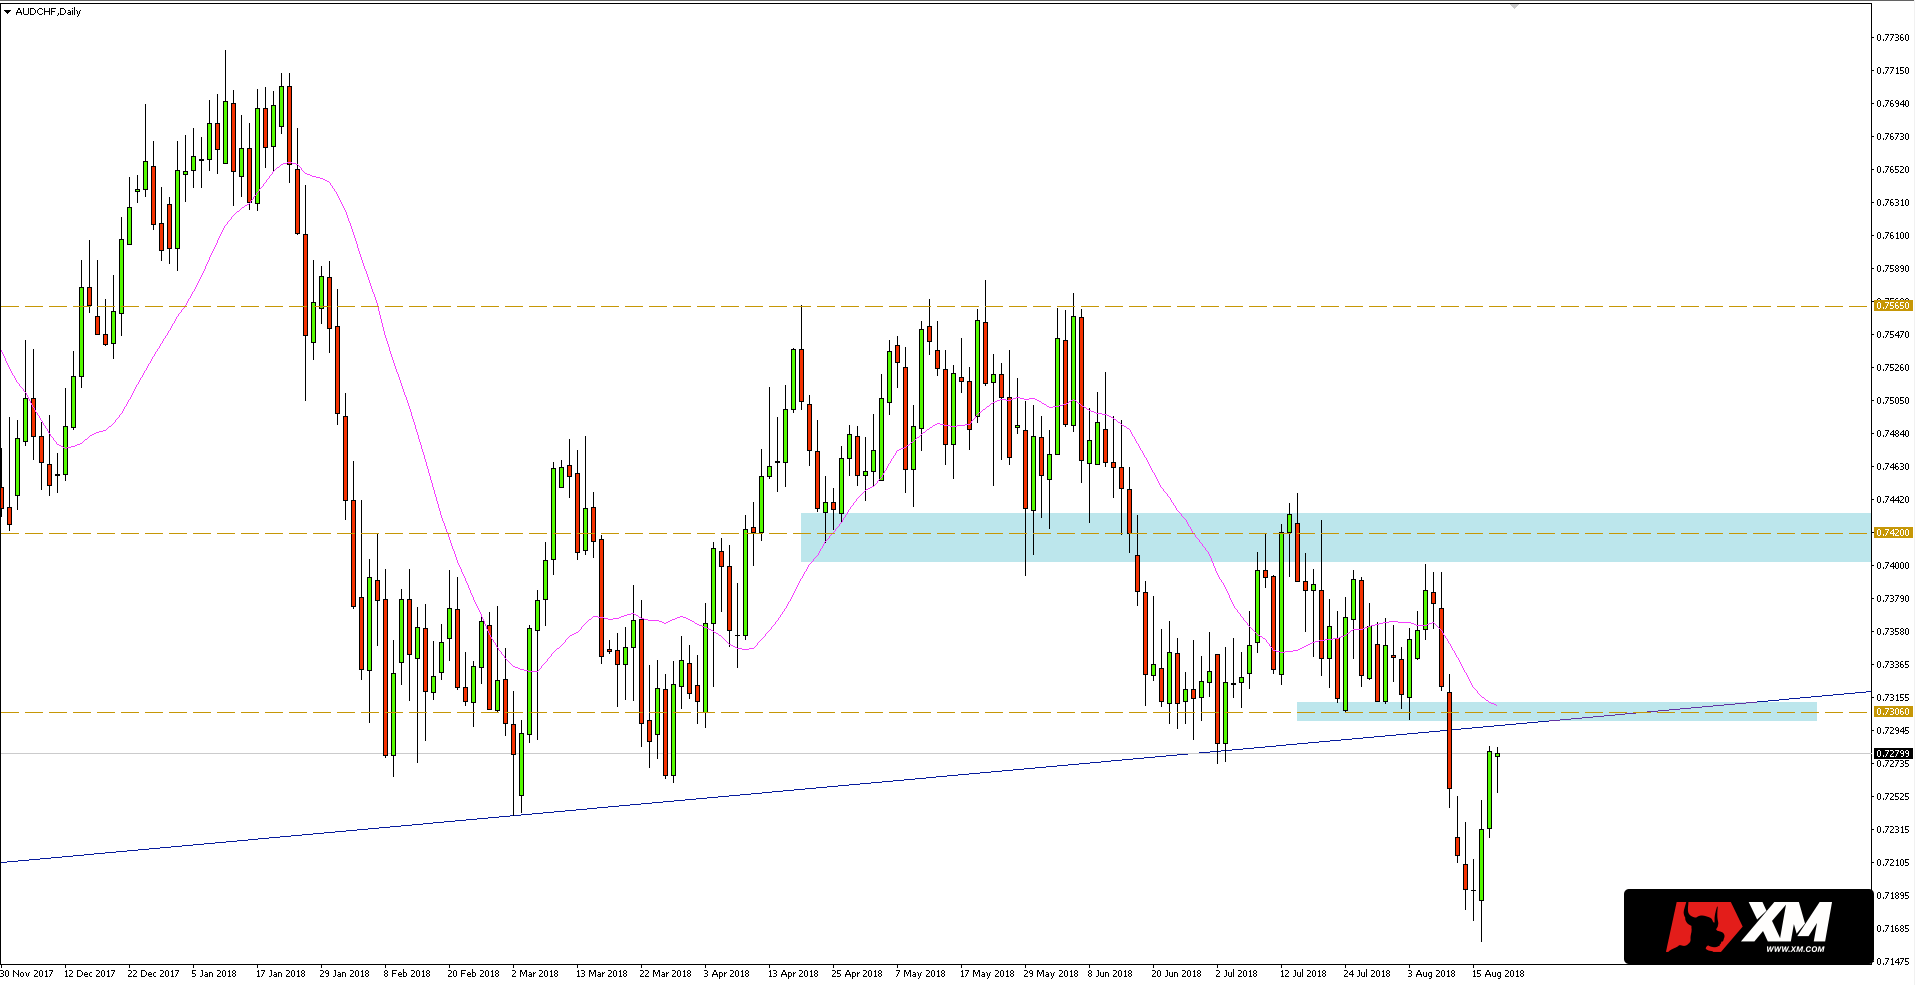
The last week’s rebound leads back to the broken trend line, which is now a resistance. In addition, as can be seen on the daily chart below, the line coincides with horizontal support within 0.7306 and a 20-day SMA, which can act as a dynamic resistance.
If the quotes respect the confluention of resistances, the rate may continue to decline after reflection. The next goal in this scenario will be the last week’s minimum, and the next, key support will be found near the low from 2017 at 0.7132.


 Review")


