Monthly S&P500 Emini futures candlestick chart: Pullback to moving average after buy climax
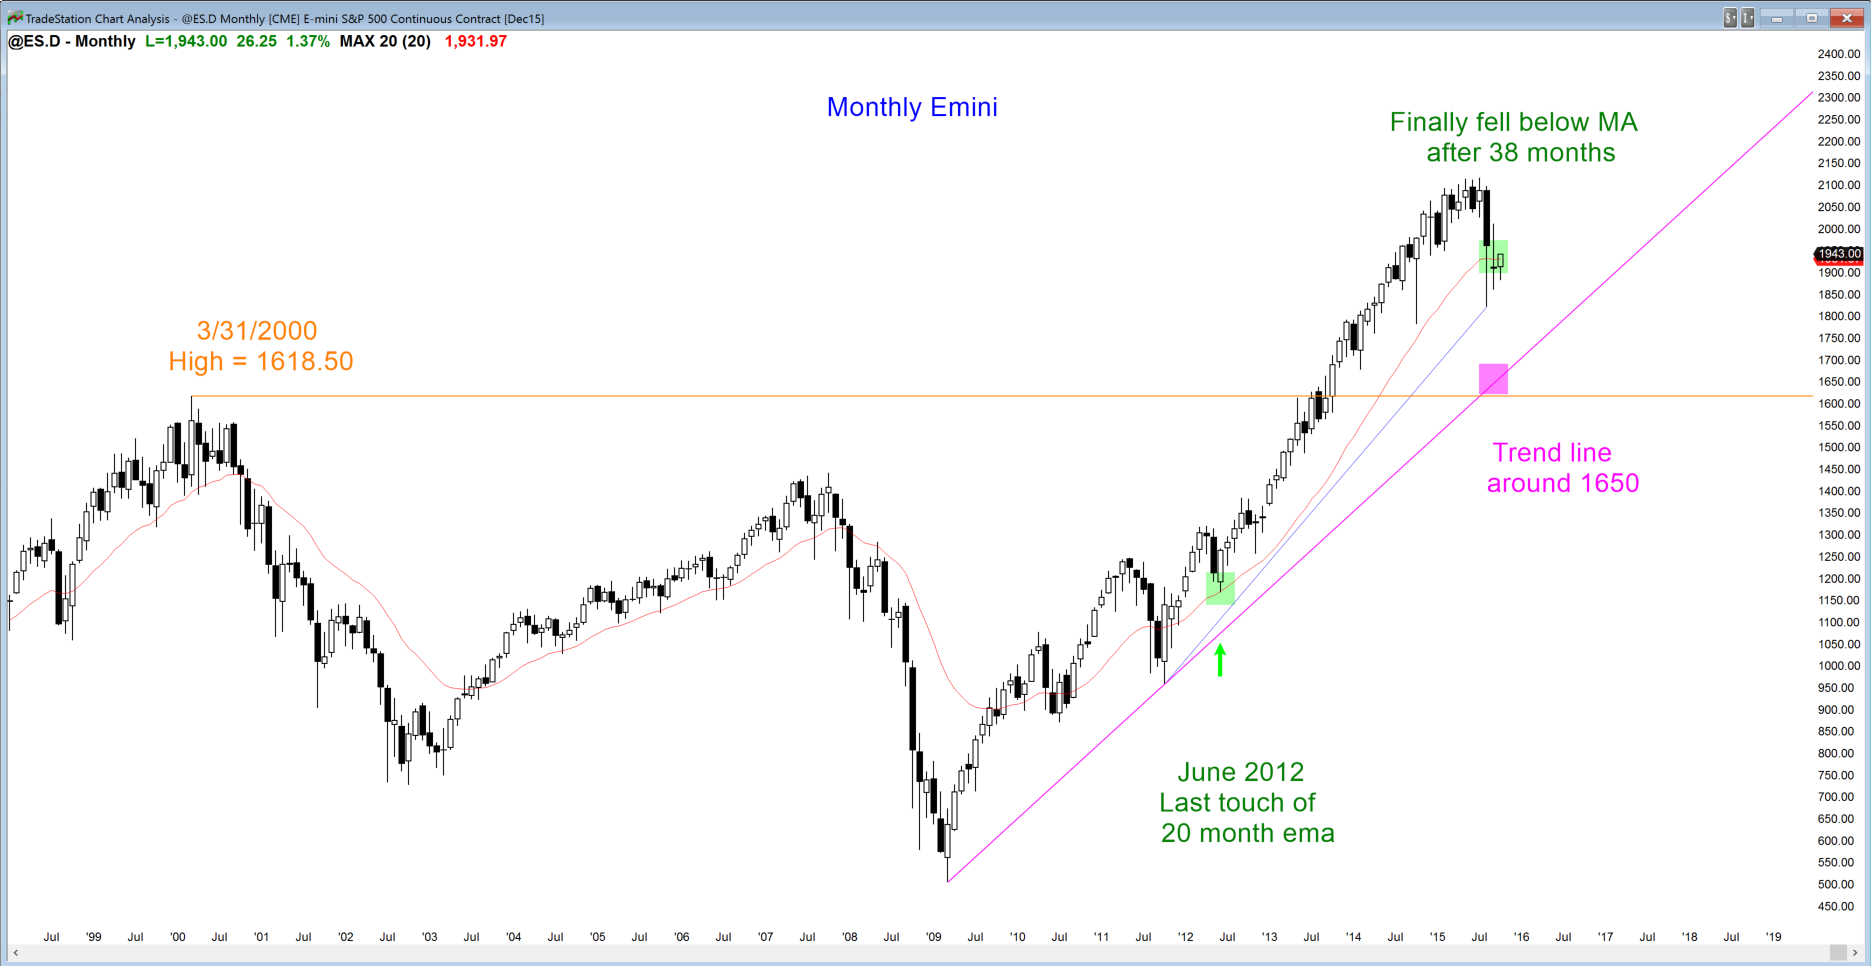
The monthly S&P500 Emini futures candlestick chart is correcting after 38 months above the moving average. The only two other times in the past 50 years when the cash index was this overbought were followed by corrections of 22% in 1998 and 36% in 1987. When there is a buy climax, the correction often falls for 2 legs and has about 10 or more bars. Since this is a monthly chart, the correction might last a year. The bulls are hoping that it is brief and does not fall below the August low. The bears want a strong breakout below the August low and then a test of the March 2000 high and the bull trend line, both below 1650.
Whatever the extent of the correction, the monthly chart is so strongly bullish that the odds favor the correction being a bull flag that will be followed by a bull breakout. However, when a buy climax forms late in a bull trend and there is then a bull flag, the breakout above the final bull flag often fails and is followed by a big reversal. If the bulls do succeed at getting a new high, professional traders will be ready to short a reversal down because the trend down might last a couple of years.
Weekly S&P500 Emini futures candlestick chart: Strong reversal up
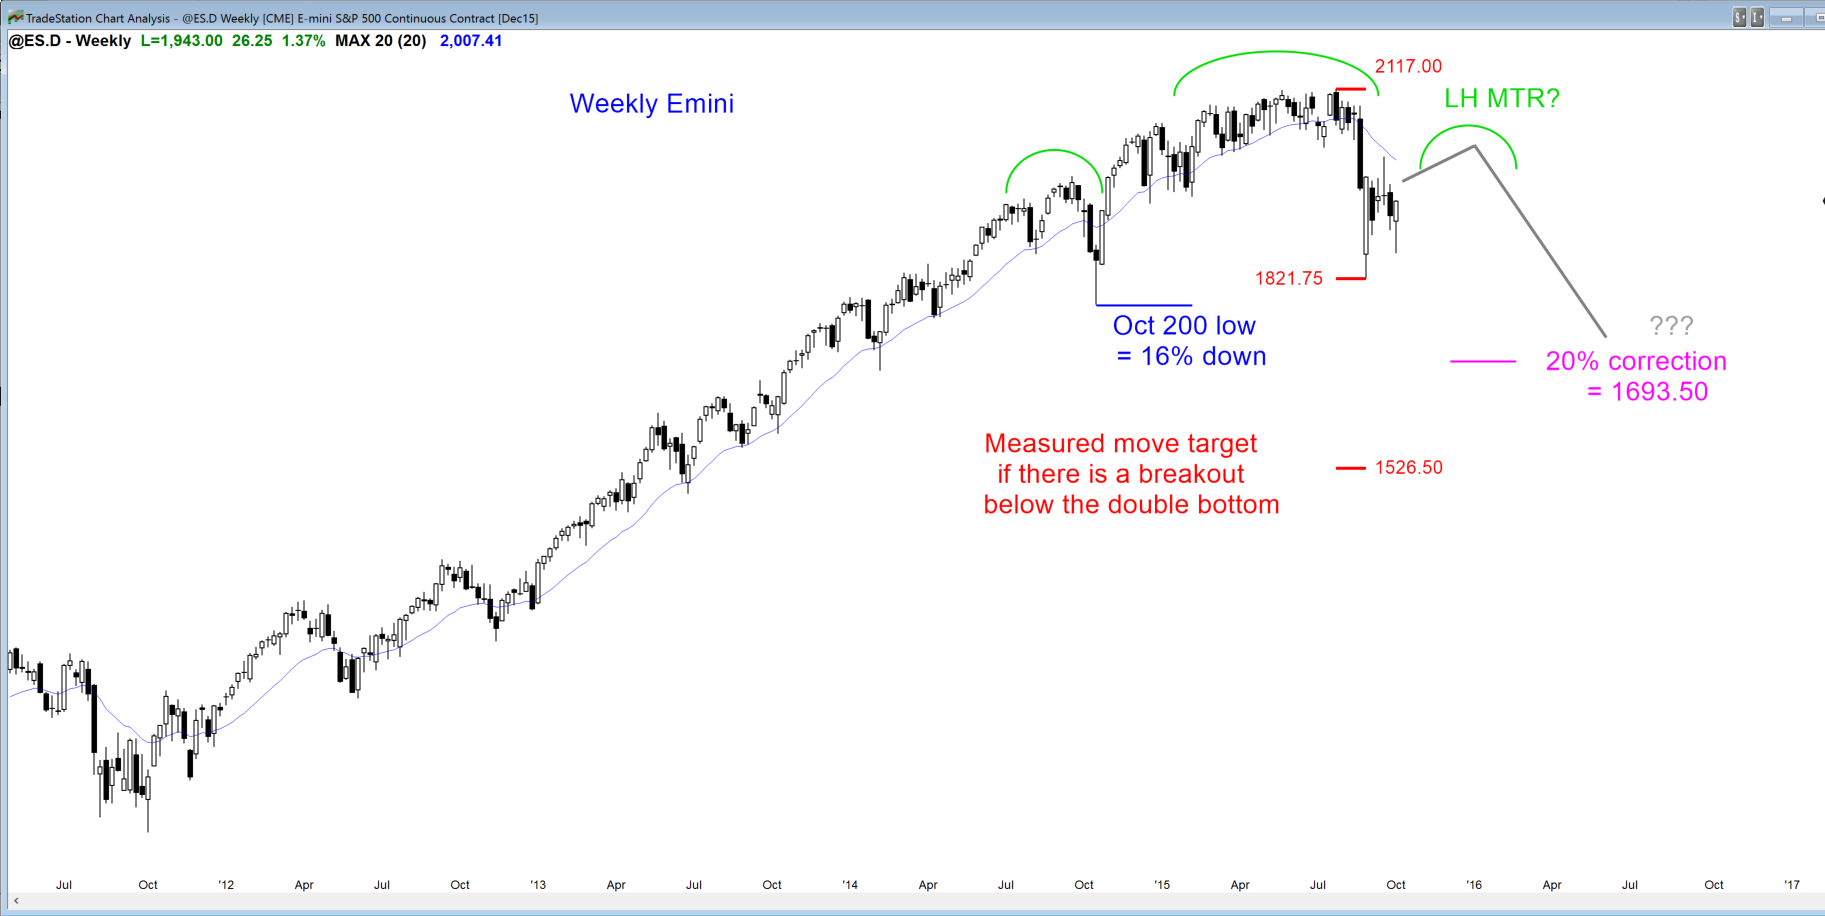
The weekly S&P500 Emini futures candlestick chart found buyers again above last October’s low. This week and the October 2014 low and the August low are three pushes down in a trading range, and therefore a triangle. The weekly chart is in breakout mode, and the breakout up or down might lead to a measured move based on the height of the year long trading range.
Although the candlestick pattern this week was a strong bull reversal buy signal bar, the Emini is in the middle of a trading range and just below the moving average. This makes the reversal attempt minor and it is more likely to be followed by more trading range price action than a resumption of the bull trend.
Because it is an obvious buy signal, the bulls next week will try to break above this week’s high. Because the Emini is in a trading range, the odds are that the bulls will be disappointed by the bull breakout or by the follow-through, and the trading range will continue.
If the bulls are able to rally strong above the moving average, they might get a breakout above the September lower high and then test the all-time high. It is more likely that there will be limited and disappointing follow-through over the next couple of weeks and that the trading range will continue.
Daily S&P500 Emini futures candlestick chart: Candlestick pattern is a bull trend reversal in a trading range
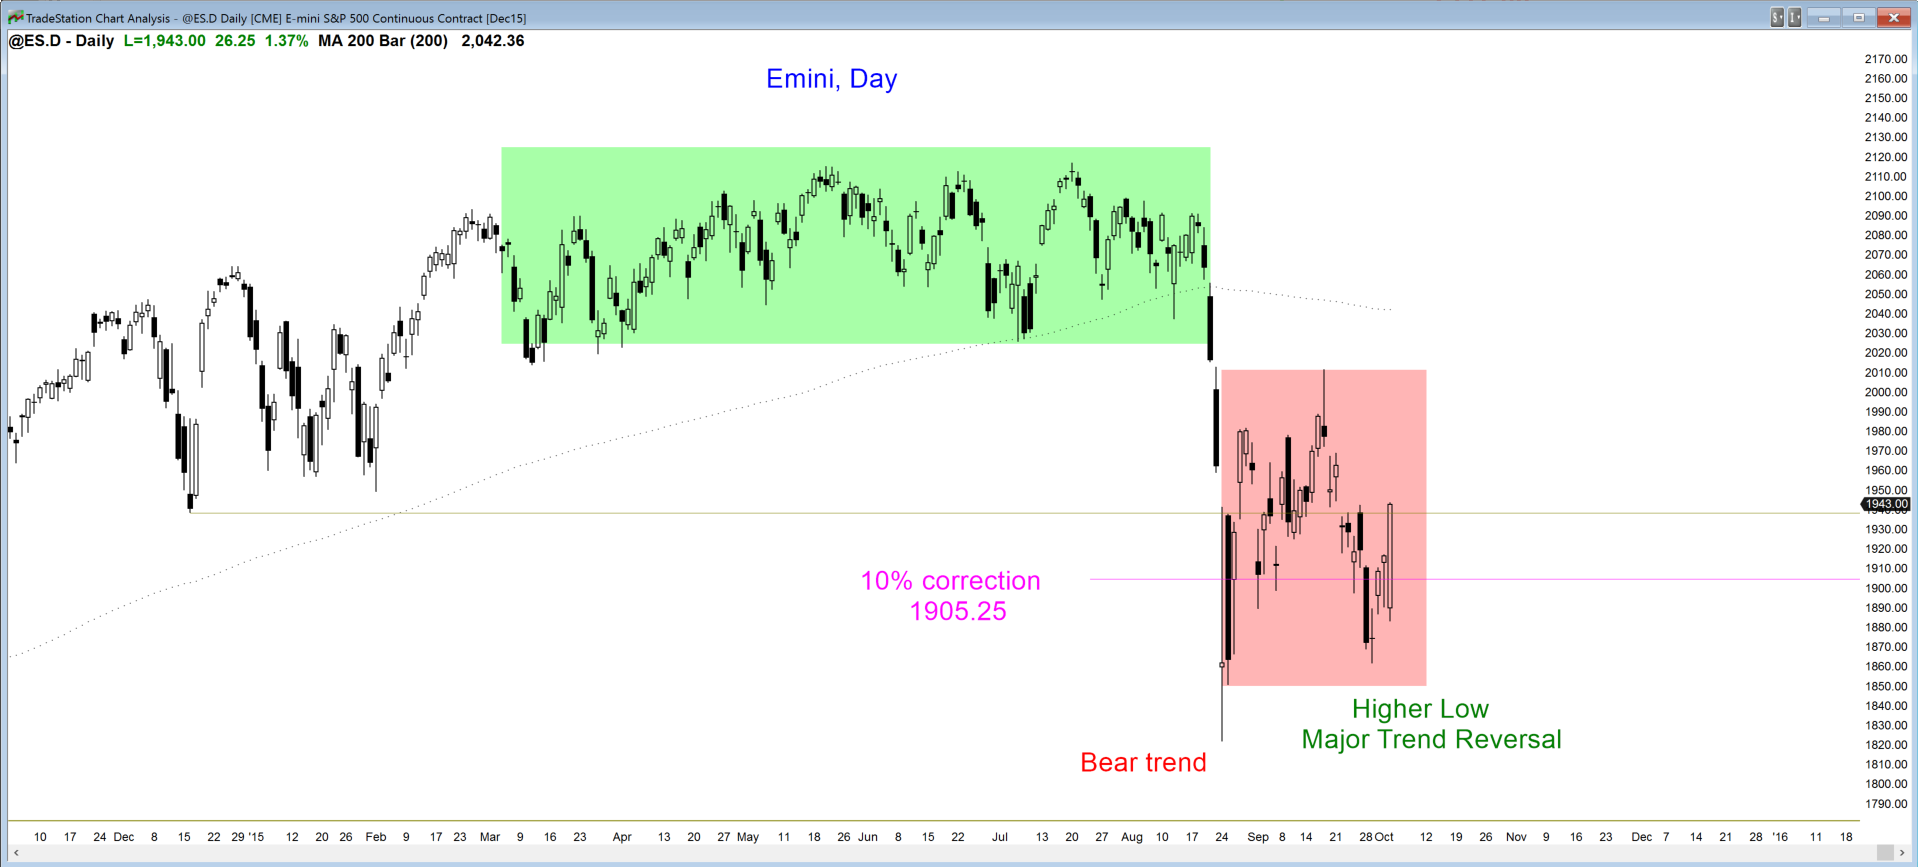
The daily S&P500 Emini futures candlestick chart reversed up strongly from the bottom of the trading range, but it is still in a bear trend. This is a higher lowmajor trend reversal. If it fails to get above the September high, those who trade the markets for a living will begin refer to the trading range as a triangle.
The daily chart is in a bear trend and has a 60% chance of a 2nd leg down. There is a 40% chance of a test of the all-time high before there is a deeper test of the August low. As more bars get added to the trading range, the probability of the bears will decrease. If the range lasts for several months, the probability of the bears will fall to that of the bulls and a bull breakout will become as likely as a bear breakout. This would be a breakout modecandlestick pattern.
Original post was published at Al Brooks Price Action Trading Blog. Check Brooks Trading Course and get The most comprehensive source of information on price action trading available!


 Review")


