USDCHF
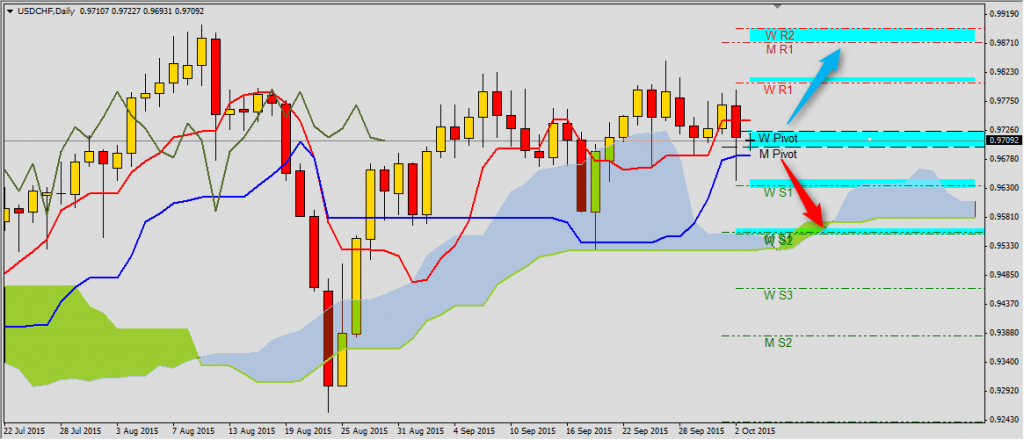
On USDCHF there is still active buy signal from crossing Kijun-sen and Tenkan-sen, Chikou Span is above the chart and bullish Kumo is below. It suggests another break above Tenkan-sen 0.9743 and range of this move is R1 0.9805 and then monthly R1 and weekly R2 0.9872-0.9896. Decrease below Kijun-sen 0.9685 will mean further correction to WS1 0.9633 and WS2 0.9553. You have to set Stop Loss above or under weekly or monthly pivot. You can trade using Ichimoku strategy with free FxGrow account.
USDJPY
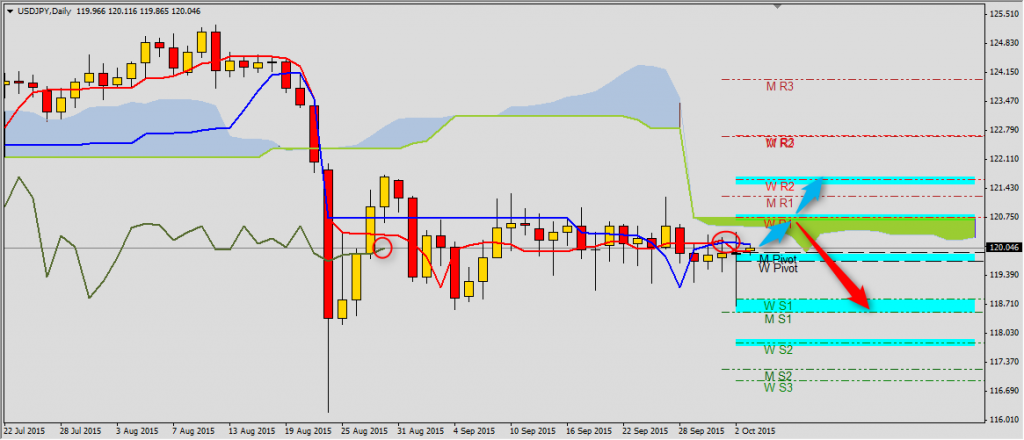
Decreases on this pair stopped in the 118.50/80 area, where we can find now weekly and monthly S1. Despite price coming back to Tenkan-sen and Kijun-sen there is still sell signal from crossing these two lines. The most important resistance is third level of balance Senkou Span B and weekly R1 120.75. Breaking this level will mean coming back to weekly R2 121.63.
AUDUSD
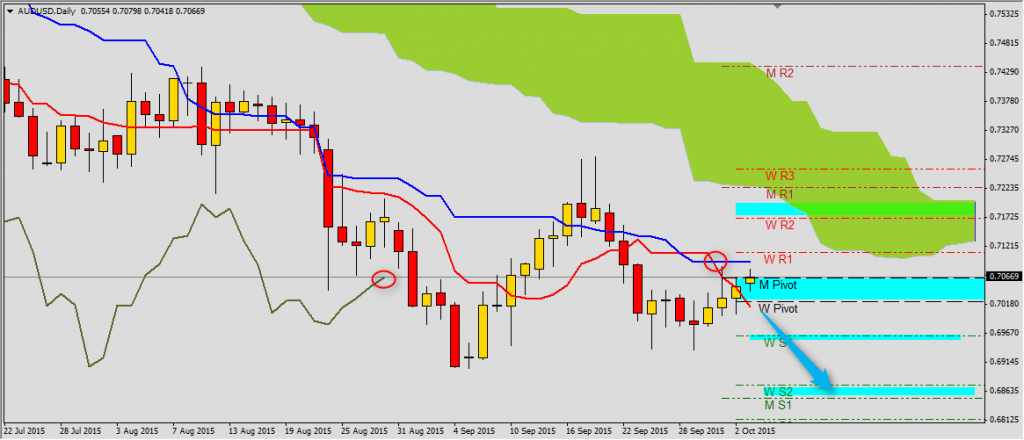
AUDUSD is close to monthly pivot 0.7064. We should wait for another decrease below Tenkan-sen 0.7012 to confirm bearish trend. Price will be also below weekly and monthly pivot and the range will be WS1 0.6961 and then WS2-MS1 0.6874-0.6850.


