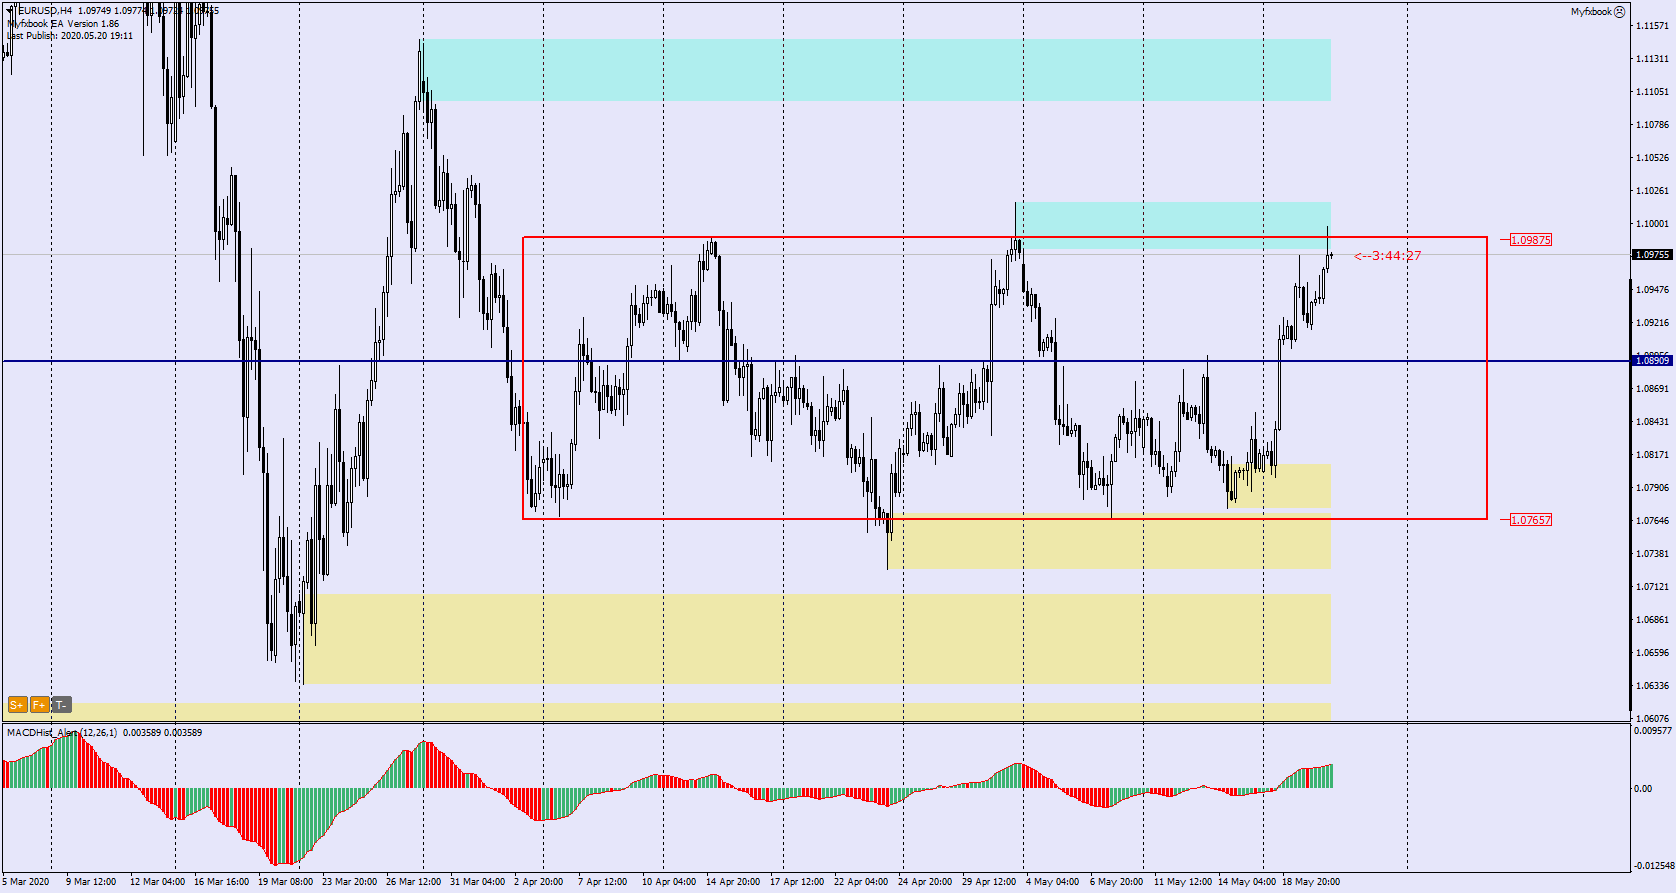
EURUSD has been moving into a 220p consolidation range for nearly 2 months.
Today the price has reached the upper limit of this consolidation which range extends between 1.0765 (support) and 1.0990 (resistance). In the H4 chart the MACD is still in an upward phase.
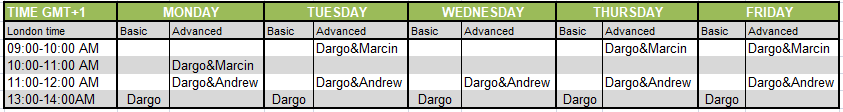
From Monday to Friday – Live trading at 13:00 (London time) chat, analyse and trade with me: https://www.xm.com/live-player/basic
The situation on the hourly chart H1 (below) looks interesting. Here, at the time of writing this analysis, after closing the 19:00 hour candle there was a downward divergence between the price chart and the MACD.

If the next “hourly” candles continue the declining trend in the MACD, we can expect further declines and the price may move towards local channel support and if it is beaten, it will go down to S/R 1.0890, which is roughly in the middle of this consolidation.
A good confirmation of the continuation of the declines would be a maximum on the MACD in the H4 interval and the switch of the oscillator to a downward phase.
If, however, the price will break out of the consolidation and successfully overcome 1.0990, the nearest demand target will be the supply zone 1.1030.
In our Facebook group, which you can join anytime: https://www.facebook.com/groups/328412937935363/you will find 5 simple strategies on which my trading is based. There, every day we post fresh analyses of currency pairs and commodities


 Review")


