It is beginning of the last week of May, a month that is definitely unfavourable for the British pound, during which a pair of GBPUSD has lost over 420p.
I must admit that this is no surprise to me, the falls were already signalled on April 1st by the appearance of the “death cross” when the SMA50 defeated the SMA200 from the top.

In April, the price tried twice to defeat the level 1.2650 where the average SMA200 was at that time.
A bearish Double Top formation was formed where we can accept level 1.2240 as the bottom of the formation. The Double Top forms the resistance of the ascending triangle, whose support is also the neck line of the Head and Shoulders pattern.
You can see me trading live every day from Monday to Friday between 1 p.m. and 2 p.m. (London time). During the live sessions I make analysis and show how I trade according to my strategies, I will also answer to your questions in the chat room. All you need to watch my live sessions is enter here: https://www.xm.com/live-player/intermediate
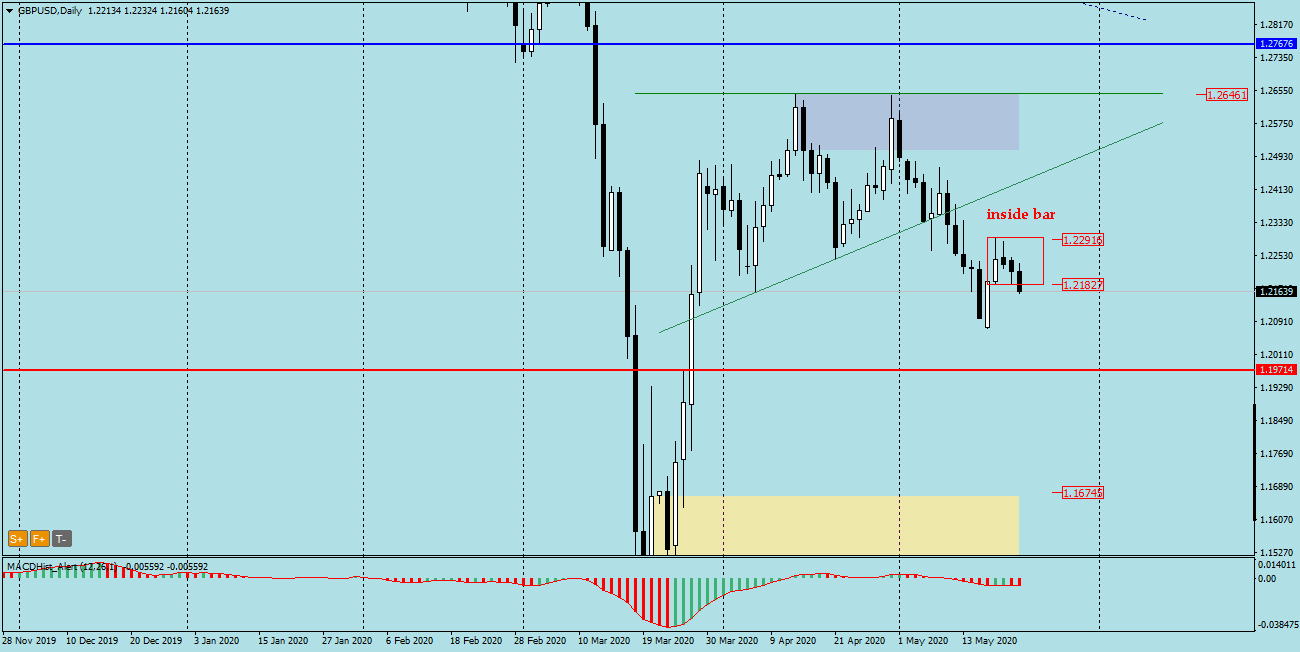
Currently, the price has broken down from the formation of the inside bar formed by the daily candle from 19.05. This seems to be a signal to continue the declines towards the nearest demand zone at 1.2080. The downward scenario is supported by the poor macro-economic performance of the UK economy and poor progress of talks on the trade agreement between the EU and the UK, the “no deal” Brexit probability increases, only 6 months left to sign the deal…
In our Facebook group, which you can join anytime: https://www.facebook.com/groups/328412937935363/ you will find 5 simple strategies on which my trading is based. There, every day we post fresh analyses of currency pairs and commodities


 Review")


