EURUSD
Decreases stopped on (4/8) 1.1231 line and today chart broke first resistance – Kijun-sen 1.1304. More important is Tenkan-sen and (5/8) 1.1352 line. Break above this level will generate another buy signal with first range 1.1475. It is also possible that price will rebound from this level and will come back to Senkou Span B 1.1143. It would be classic ABCD correction.
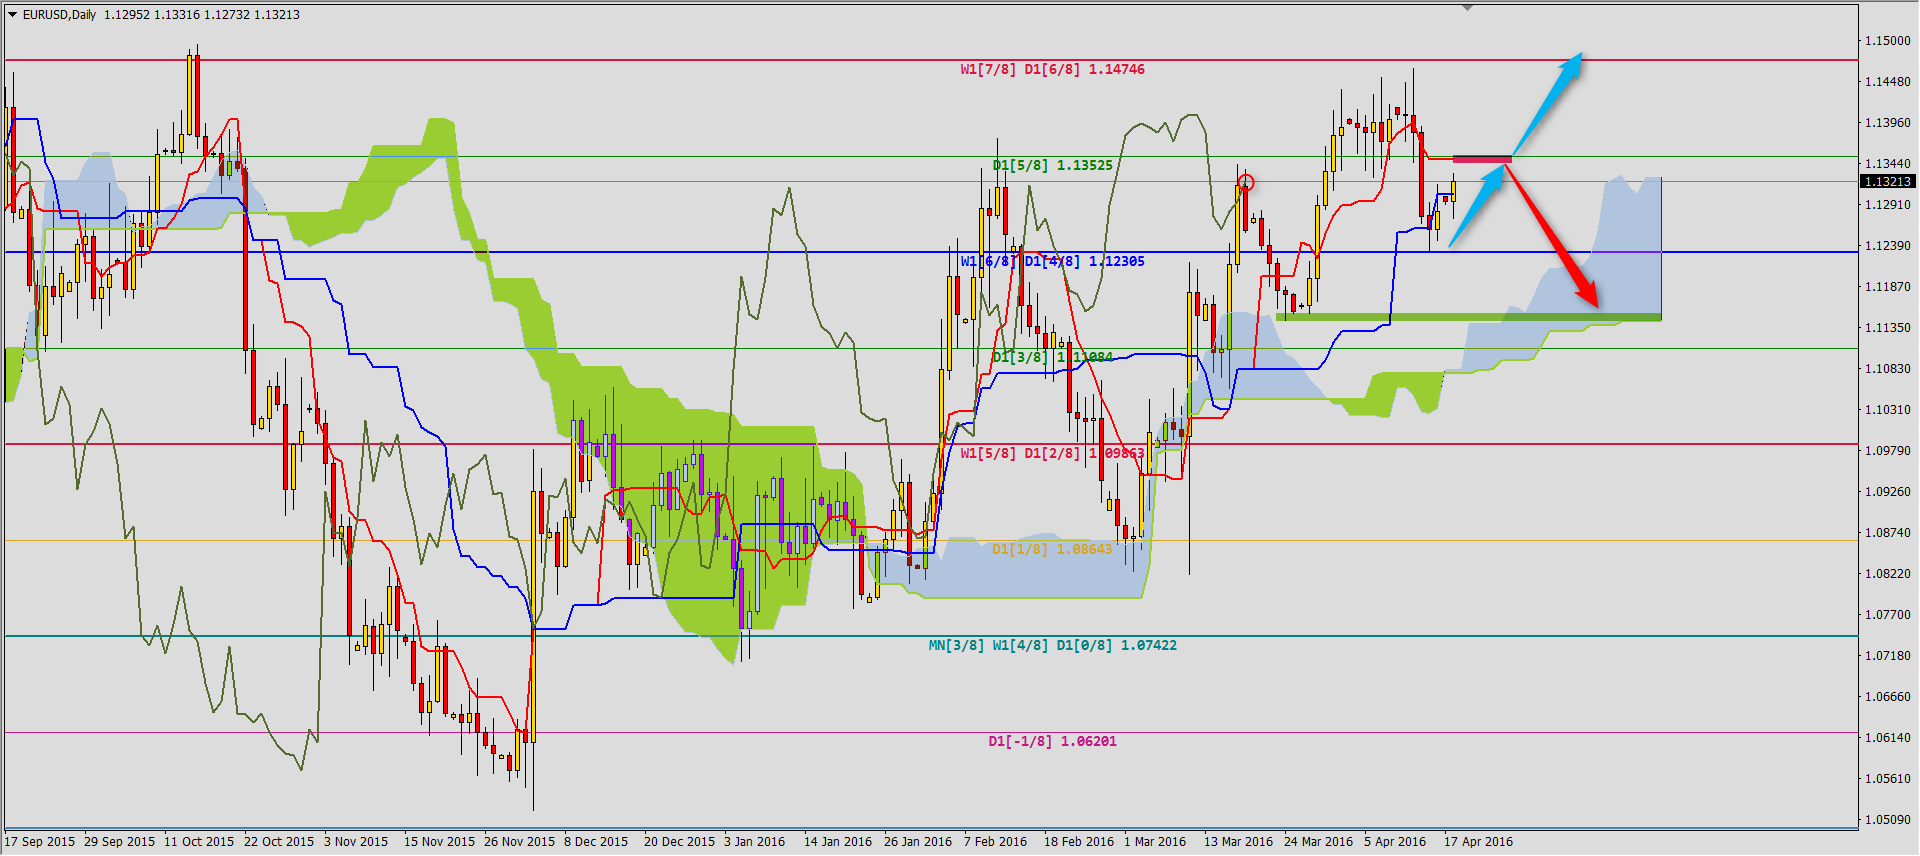
Why should we also consider bearish scenario? Because on H4 situation doesn’t look so good. Although decreases stopped close to (0/8) line but so far chart broke only Tenkan-sen and is struggling with Kijun-sen resistance.Third level of balance – Senkou Span B – is at 1.1350. As long as EURUSD stay below this level, last gains are just a correction of bearish trend. Tomorrow chart will be below bearish Kumo what will generate sell signal.
You can read Ichimoku strategy description here.

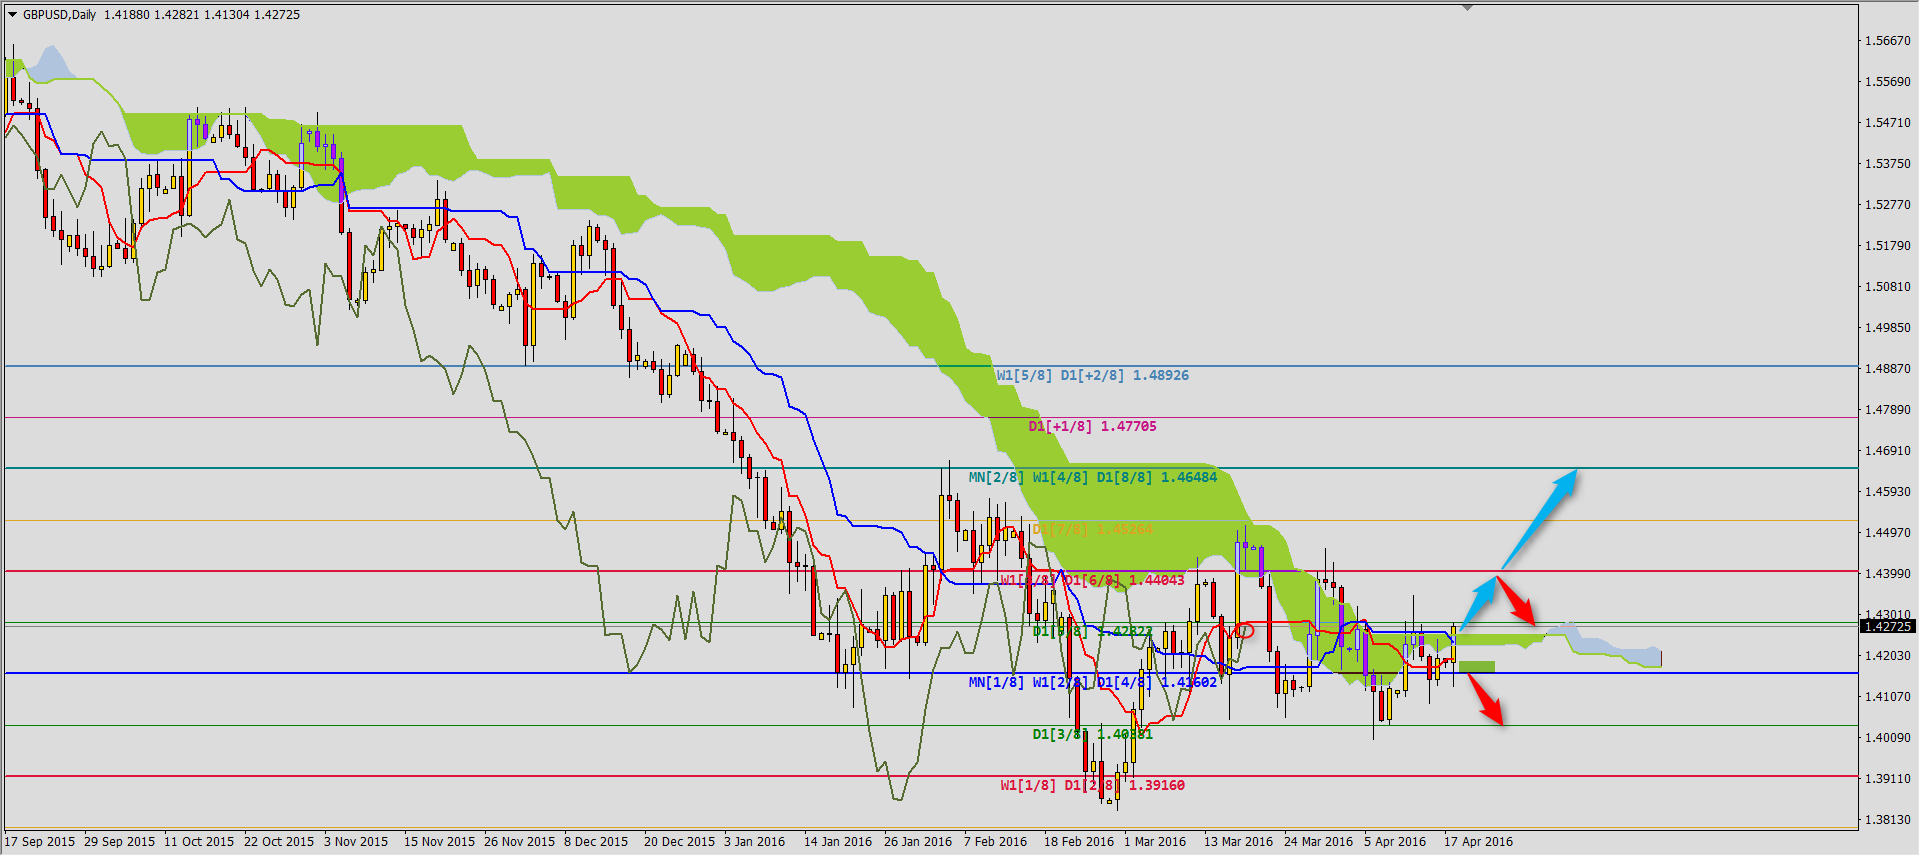
GBPUSD
For a longer time we can see side trend in this pair. Today chart reached another time to (5/8) 1.4282 resistance. Chikou Span is also at Tenkan-sen resistance.
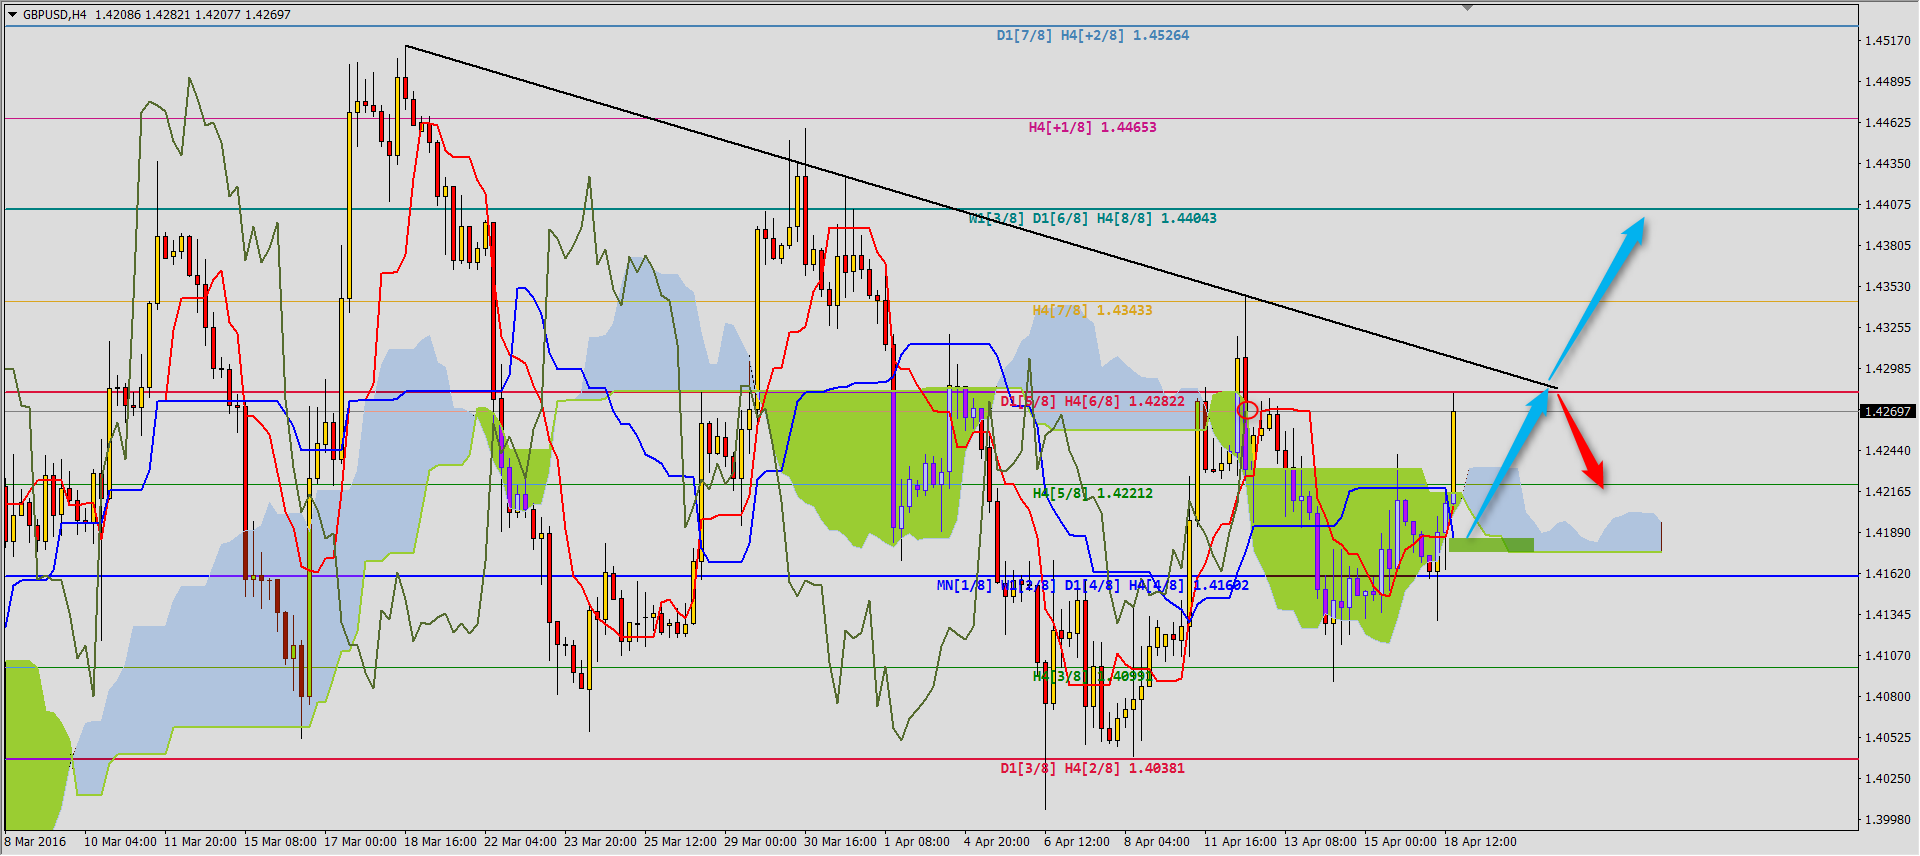
If we take a look at H4 chart we will see reversed situation: chart will be above bullish Kumo soon. Support is set by (5/8) 1.4221 line and then Kijun-sen 1.4190 and Senkou Span b 1.4176. On the other side bearish trend line resistance is close. So far it is at 1.4306. Next resistance is set by (8/8) 1.4404 line.
AUDUSD
Buy signal from April 12th is still working. Today’s correction stopped exactly at this Ichimoku line and chart is heading to (8/8) 0.7812. Only breaking this resistance will be a signal of continuation of bullish trend to higher band of Kumo on W1 chart 0.7909.
YOU CAN TRADE USING ICHIMOKU STRATEGY WITH FREE FXGROW ACCOUNT


 Review")


