EURUSD

You can read Ichimoku strategy description here.
EURUSD decreased more than 350 pips and new week started from testing monthly S1 1.1019. Price should come back to pivot 1.1132 and if this resistance won’t be break we should see continuation of depreciation to 1.0880-1.0865 area, where there is weekly S1 and monthly S2. Close above weekly pivot will mean EURSUSD going back to side trend with range of monthly pivot and Kijun-sen 1.1239. All Ichimoku indicators inform us about strong bearish tendency on EURUSD.
GBPUSD
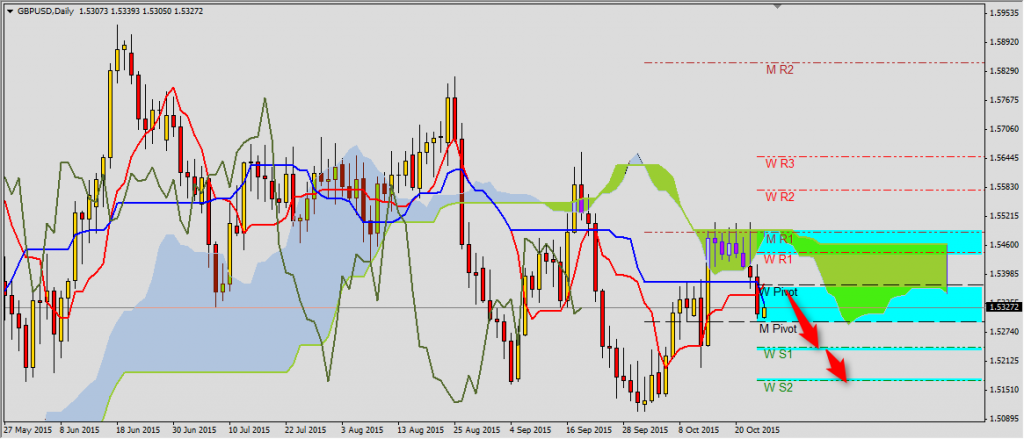
Friday’s decrease on GBPUSD below Kijun-sen and Tenkan-sen generated sell signal. Tenkan-sen 1.5377 covers weekly pivot and it is now the most important resistance on this pair. The range of decreases are S1 1.5242 and S2 1.5171. Next break above this area will start side trend and price going back to 1.5444-1.5490 area where there is weekly and monthly R1 and Senkou Span B.
YOU CAN TRADE USING ICHIMOKU STRATEGY WITH FREE FXGROW ACCOUNT.
USDJPY
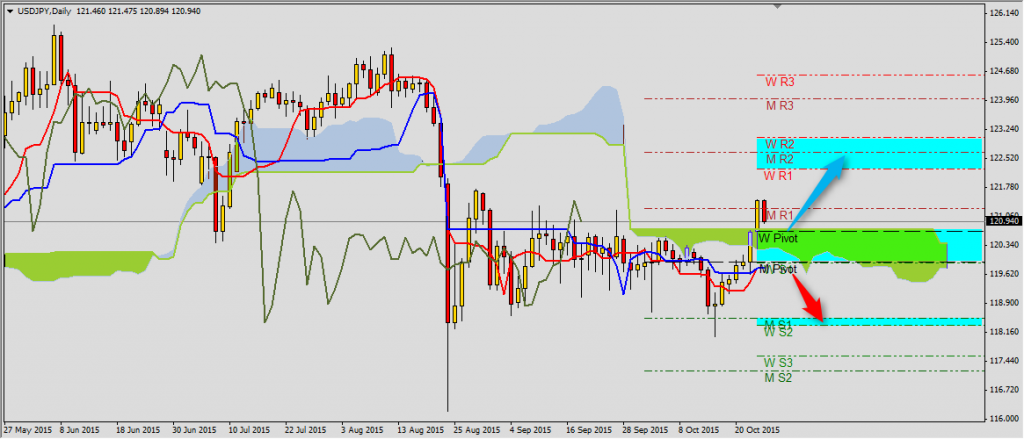
On this pair there is interesting situation. After price rebounding of lower band of channel in which this pair is since the end of August (118.50), on Friday price reached to resistance 121.25 and today is coming back to important support 120.73. It is Kumo high and weekly pivot. Price staying above this level is a condition of continuation bullish trend on USDJPY to another resistance area 122.24-123.03 set by weekly R1 and R2. Decrease below Kumo top will mean going back to Kijun-sen and monthly pivot 119.75-90. Only breaking this area will be a sign of going back to bearish trend.


 Review")


