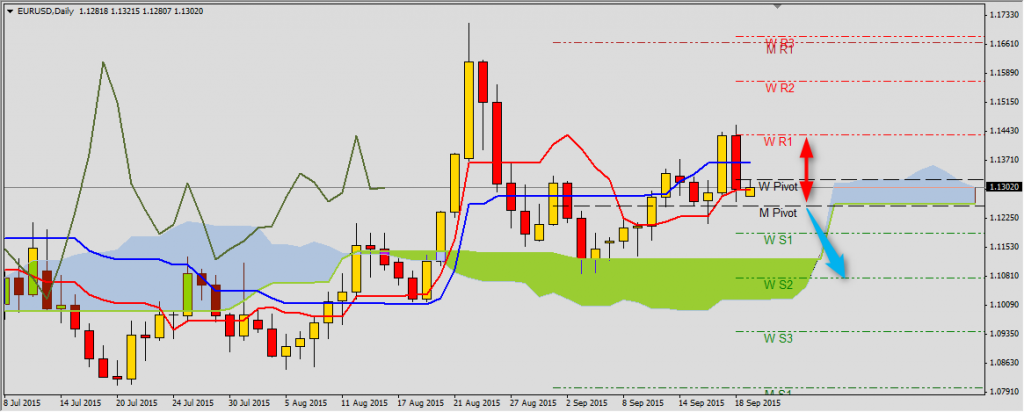
In the beginning of the new week we should not only check how currencies exchange rate react to Ichimoku lines, but also to weekly and monthly pivots, to get better picture of current resistance and support zones. EUR/USD after Friday’s decreases finds itself below weekly pivot 1.1322 and defeating Senkou Span B 1.1260 support or monthly pivot 1.1255 will indicate falls to weekly S1 1.1187 and S2 1.1075. The next level is KIjun-sen (1.1365) and R2 1.1434. Looking at Tenkan-sen and Kijun-sen it is hard to forecast any come back of upward trend at EUR/USD.
GBP/USD moves just above important support zone 1.5505-1.5490. Weekly and monthly pivots cumulate here, Tenkan-sen, Kijun-sen and Senkou Span B also. If Cable defends this zone, then price will probably move back to weekly R1 at 1.5681 or even R2 1.5833. Moving below Senkou Span B 1.5490 will bring re-test of S1 1.5352 and low from September 4th (WR2 and MR1 at 1.5176).

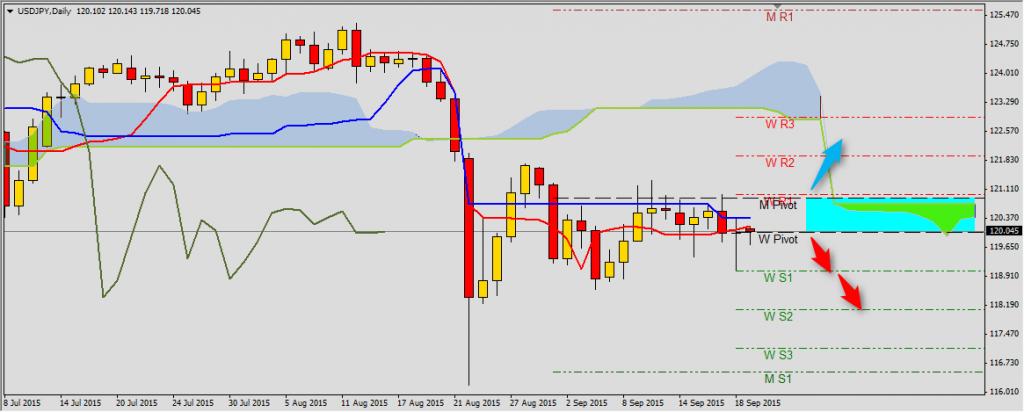
Despite Friday’s decreases, USD/JPY moves in a sideway trend (take a closer look at horizontal Kijun-sen and Senkou Span B). Price moved back to 120.01-120.87 – a range between weekly and monthly pivot. Closing the Monday’s session below this range and Tenkan-sen 120.18 may bring a downward trend continuation signal (targeting S1 119.04 and S2 118.07). Breaking above Senkou Span B 120.73 and monthly pivot will indicate however, broader sideway trend with cap at WR2 121.93.