GBPUSD
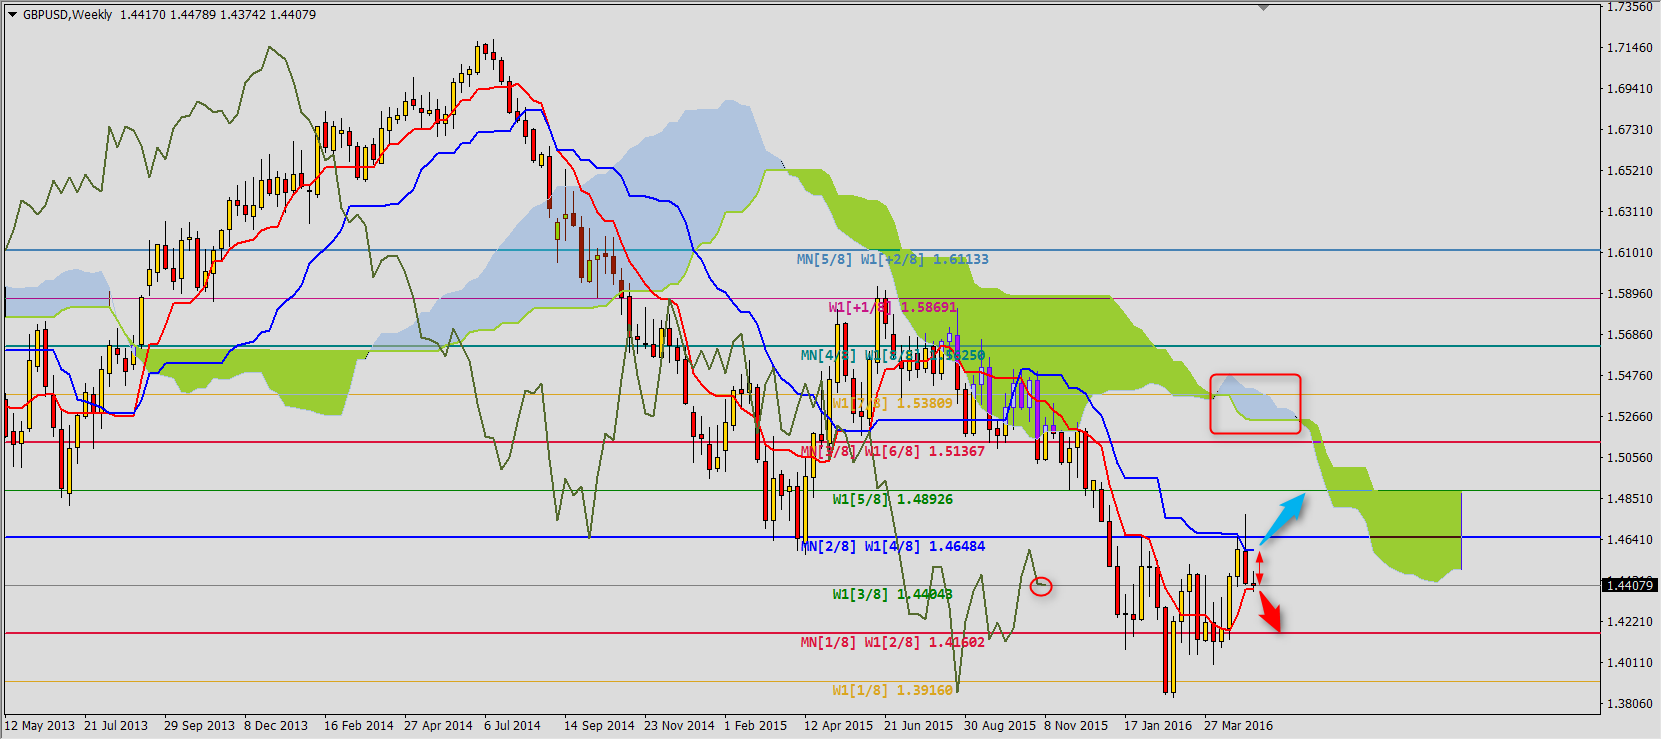
The week started from testing support area 1.4405-1.4387 created by (3/8) line and W1 Tenkan-sen. If chart will stay below Tenkan-sen it can mean continuation of decreases to (2/8) 1.4160. Only breaking Kijun-sen 1.4585 resistance will be a signal of going back to gains with potential range 1.4893 where Senku Span B and (5/8) line are located. It is worth to notice that correction of bearish trend started when chart was below bullish Kumo and it will be like this for few more weeks. It can force one more bullish wave on Cable.
You can read Ichimoku strategy description here.
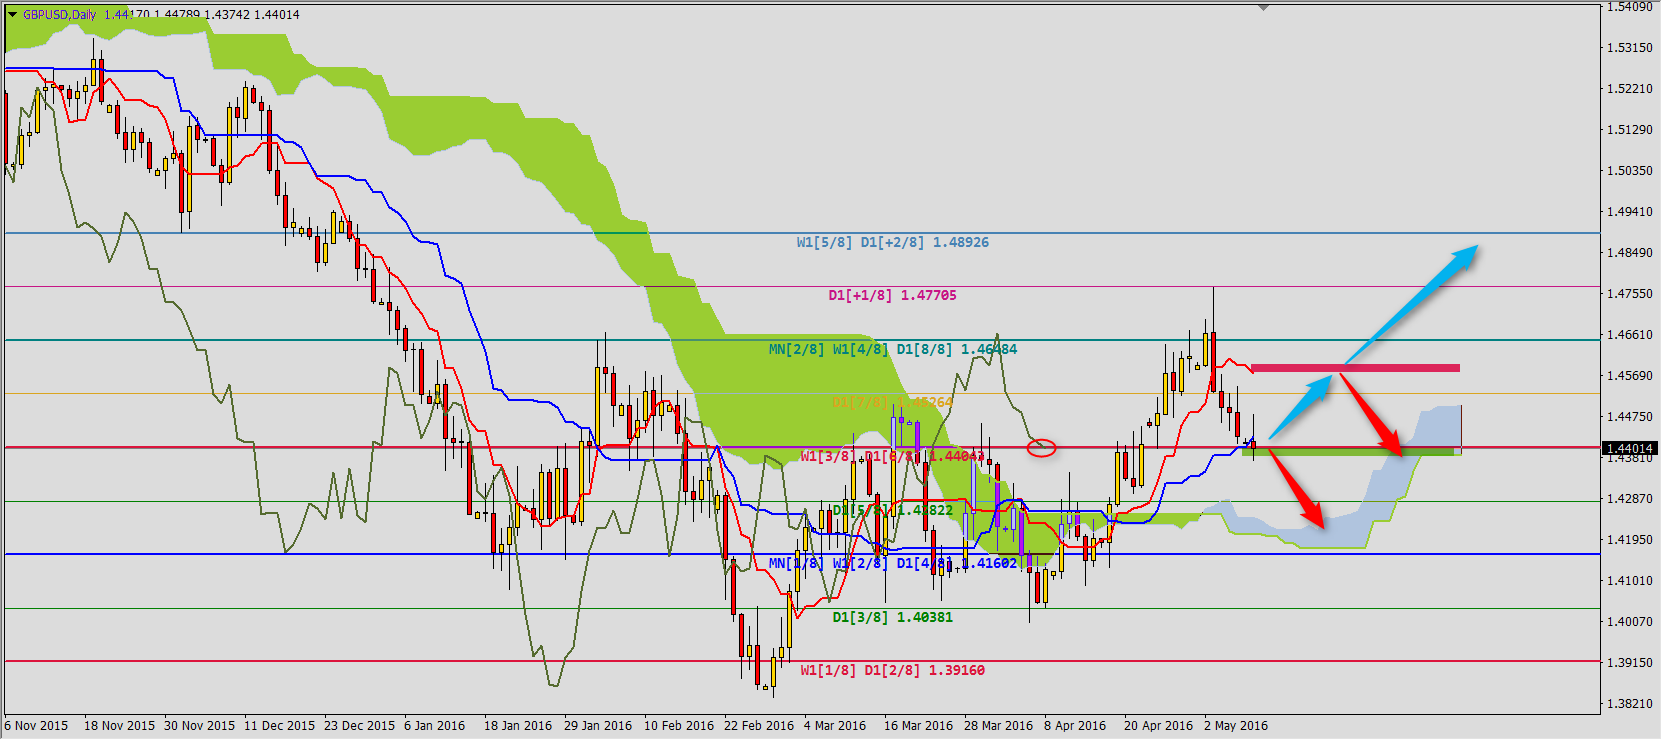
On the daily chart Senkou Span is defending against further losses. Keeping price above Kijun-sen 1.4430 is necessary for GBPUSD to move in direction of Tenkan-sen 1.4572. The most important are today’s close and next session.
AUDUSD
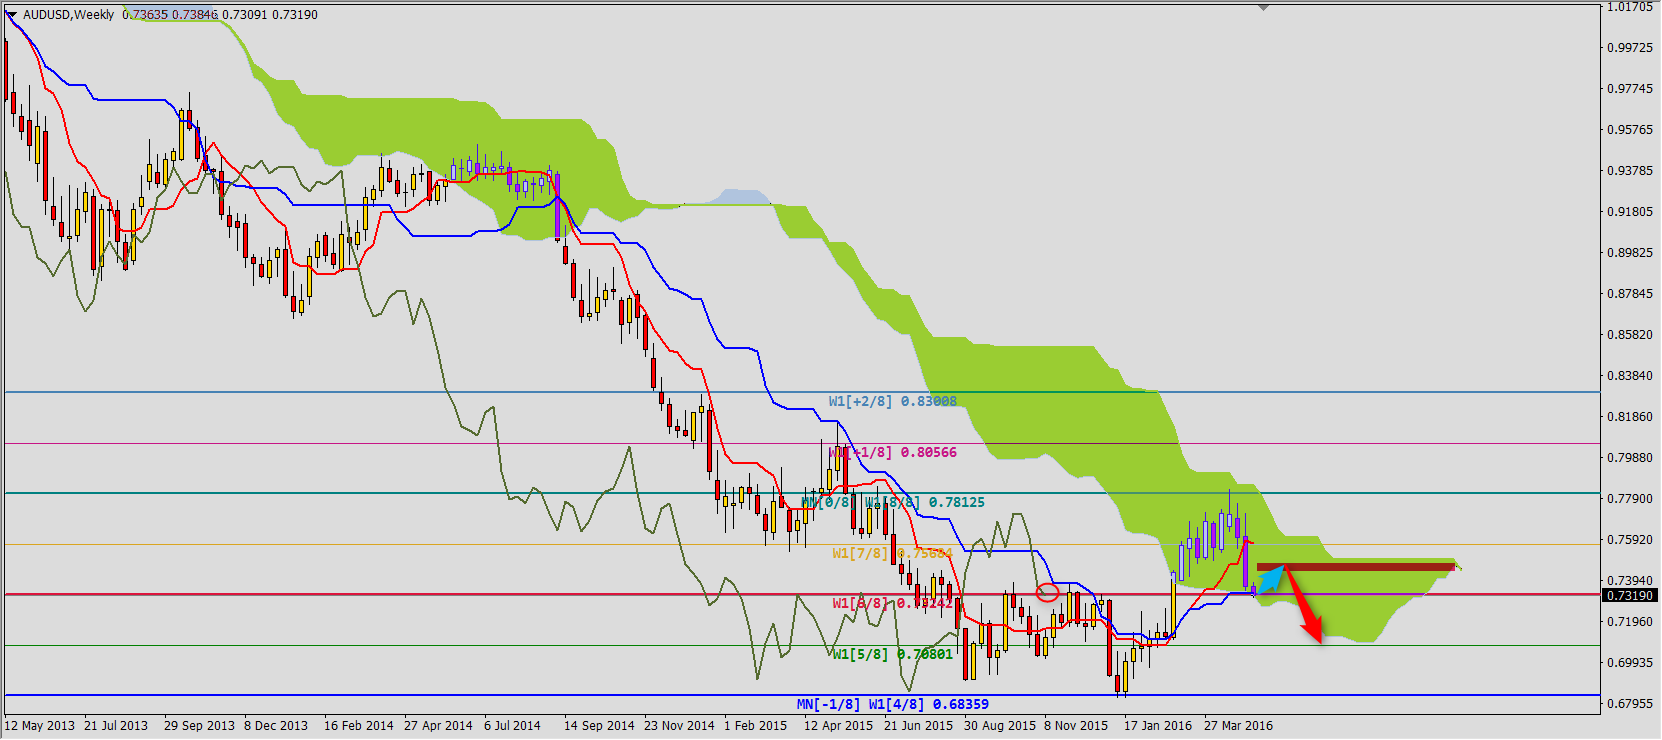
It is also testing support which was created during last analysis of this pair. First range of bearish trend was reached at 0.7324 (Kijun-sen and (6/8) line). We cannot exclude correction to Senkou Span B 0.7440 and then continuation of decreases to (5/8) 0.7080.
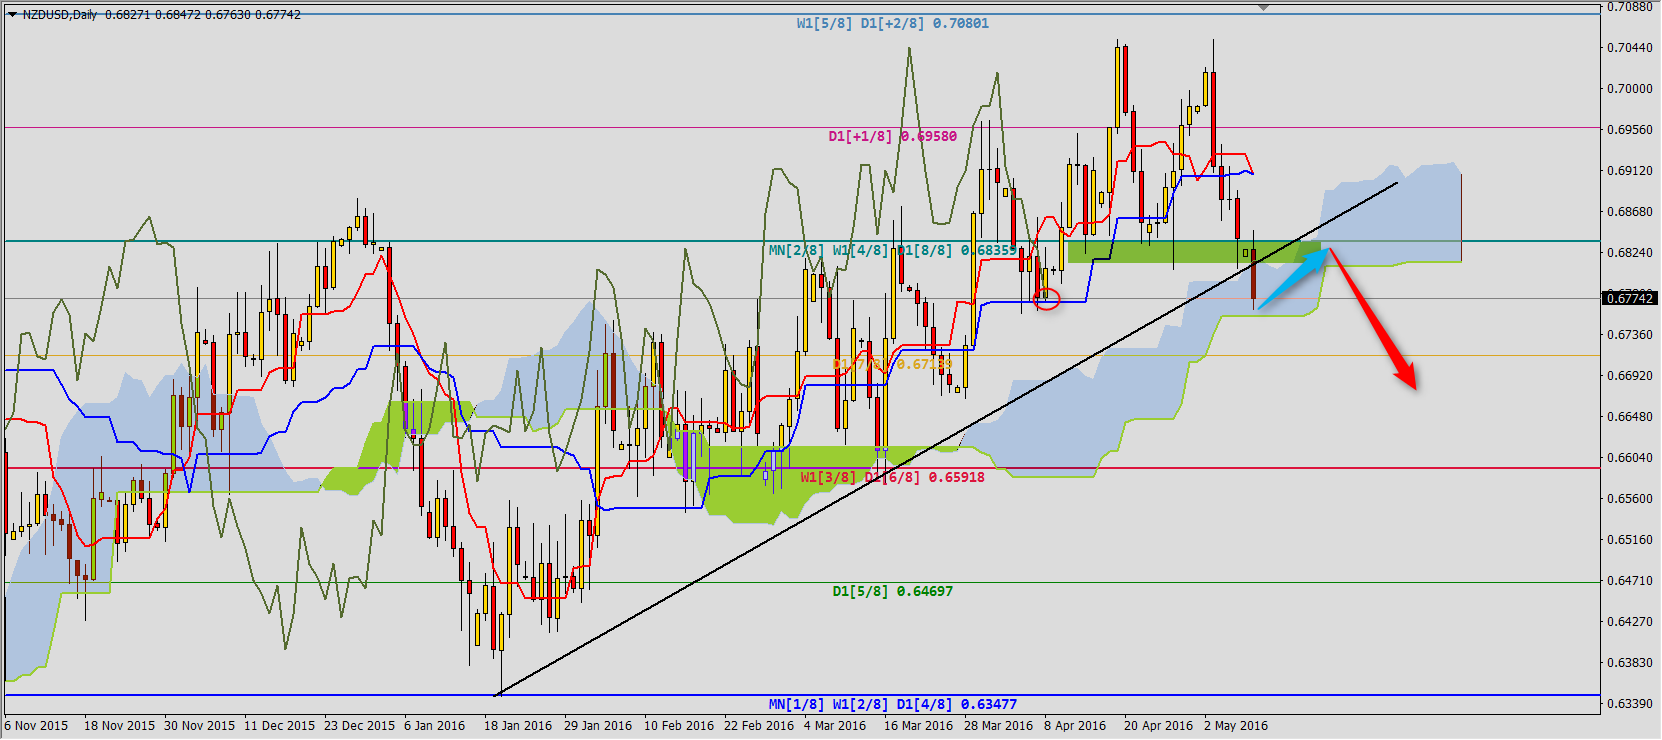
NZDUSD
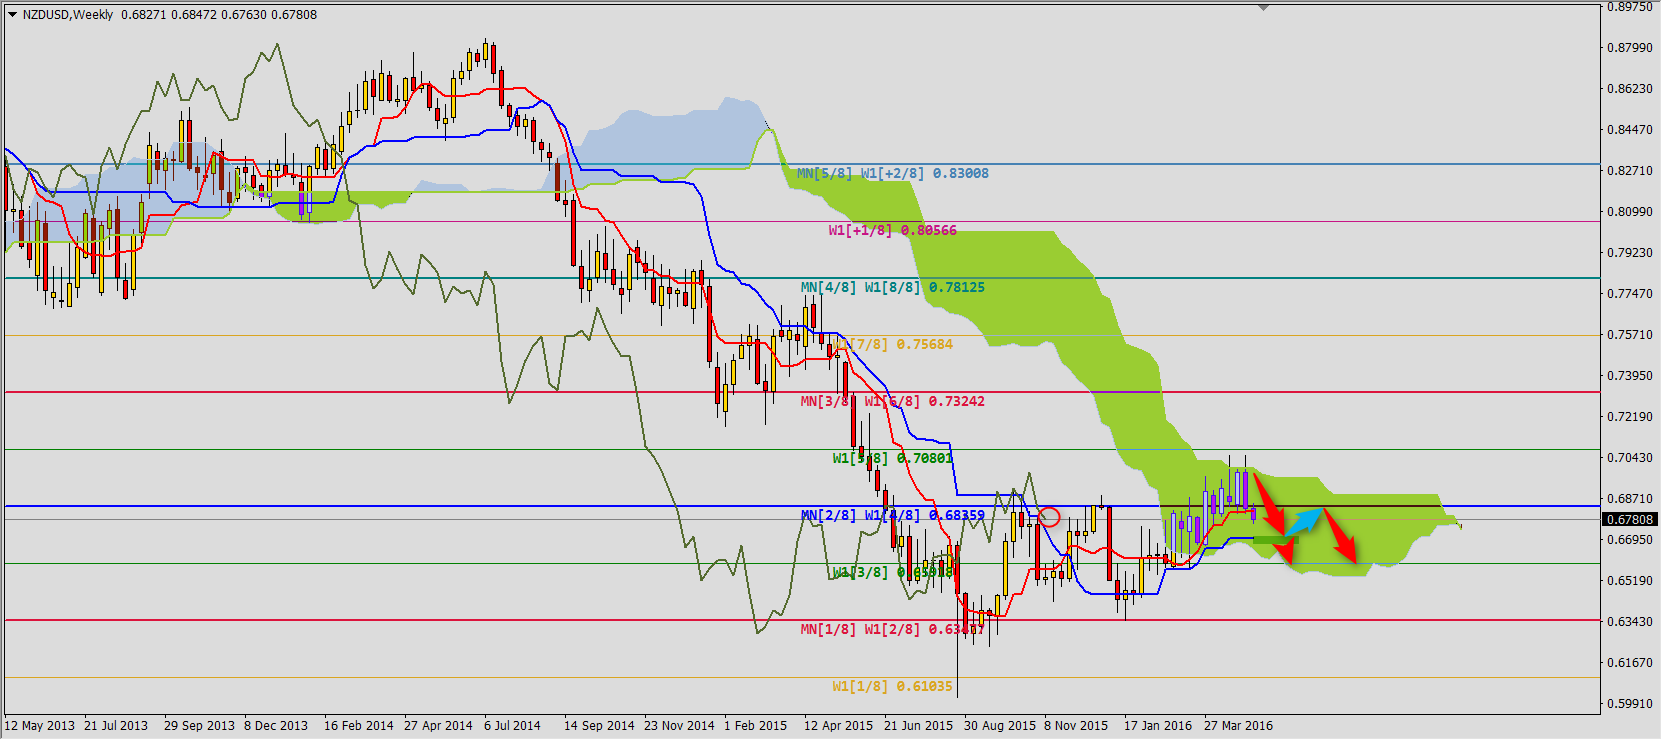
We should start analysis of this pair from weekly chart. Decrease below Tenkan-sen 0.6814 can mean test of Kijun-sen 0.6700. In this place there will be either correction either continuation of decreases to (3/8) 0.6592 line.
It is better seen on daily chart. NZDUSD broke today support area 0.6835 and bullish trend line. These level is now direct resistance. The range is set by another Murrey lines 0.6714 and 0.6592. If there will be some break above daily high at 0.6847 it will mean going back to Kijun-sen 0.6908. Possibility of correction is signalized by Chikou Span which is in important place.
YOU CAN TRADE USING ICHIMOKU STRATEGY WITH FREE FXGROW ACCOUNT


