 Ichimoku is an investment strategy of trend following, it works great on H4, D1 and higher time frames. In this series of articles I present my setups and observations using Ichimoku, supports and resistances and Price Action patterns. You can also check previous Ichimoku overview.
The weekend starts soon and we can see it on the charts. Not much is happening, the only potential signals I found were on the sterling. I already have opened position on Cable so I don’t want to increase my risk exposure, but maybe you will enter one of those markets.
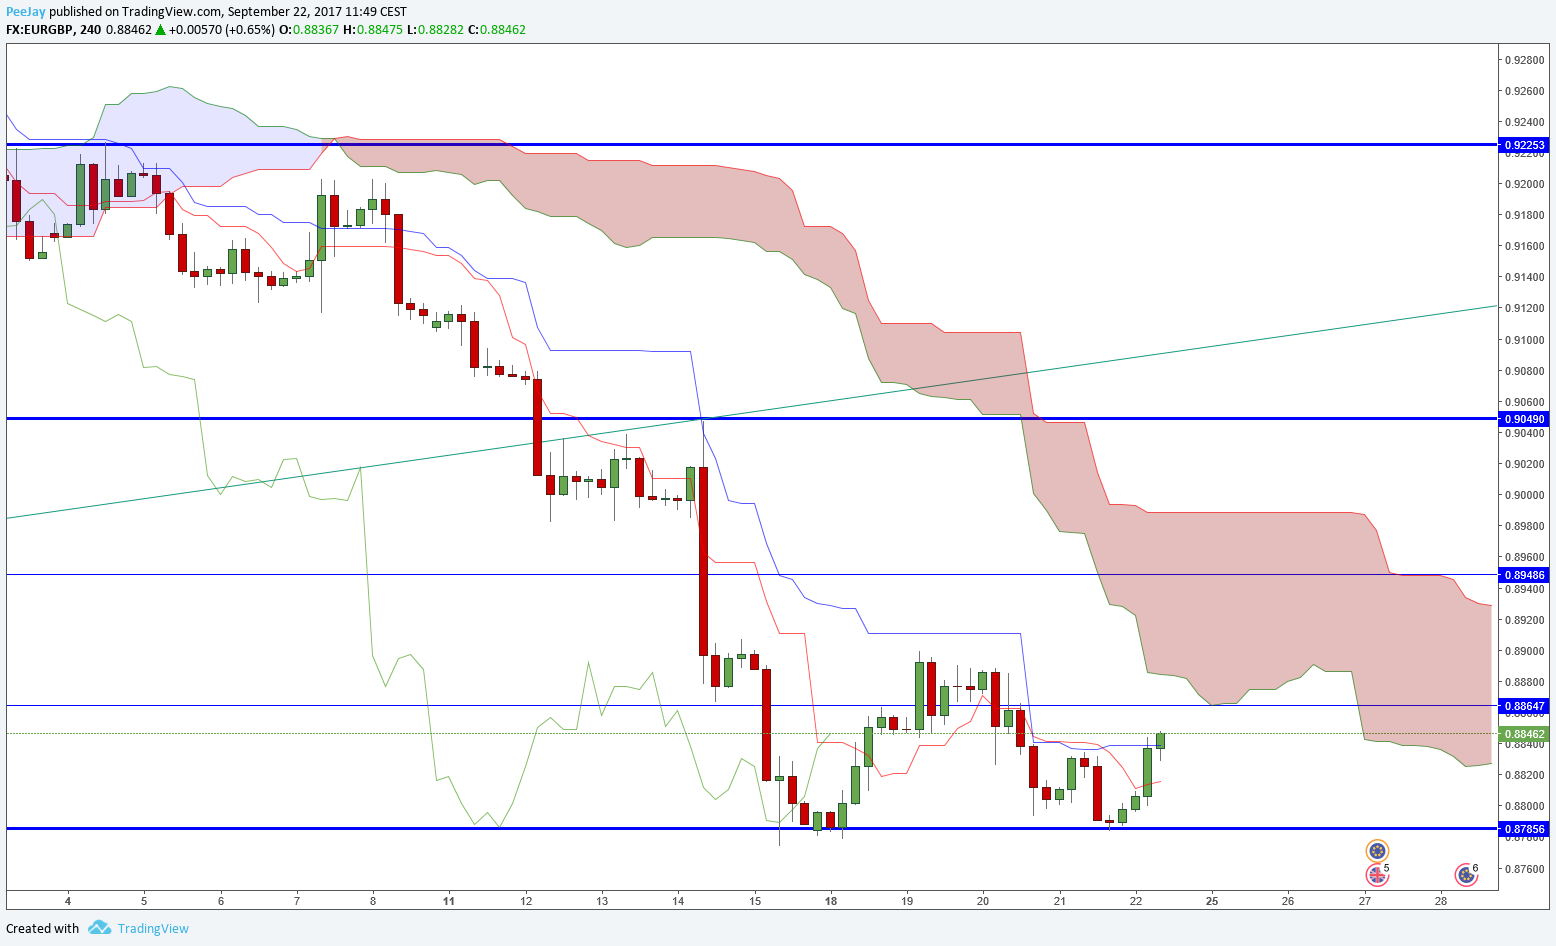
EURGBP
On the H4 chart we can see that support from daily chart on 0.8785 is still strong. Last week this pair let me earn more than 17% of the account. My advice is to stay away from this position until break of mentioned support. Ichimoku situation points on possibility of continuation of decreases, however Senkou Span line is above the chart, what can indicate consolidation.
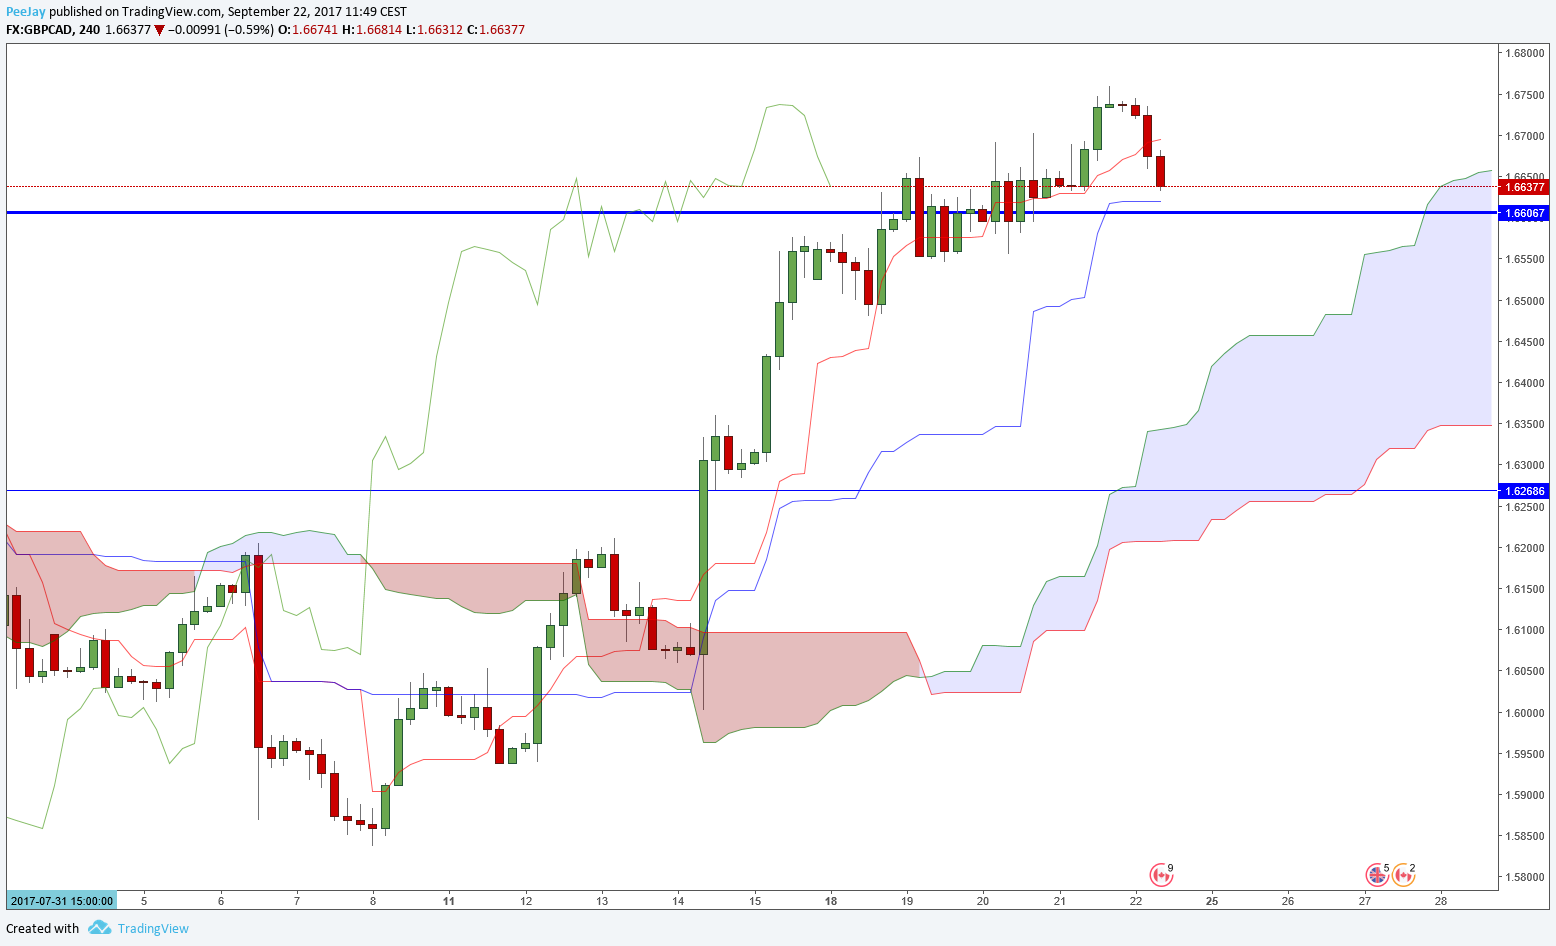
GBPCAD
On the H4 chart we can see that the price finally broke through resistance in 1.6600 area, which it was struggling with for most of the week. Currently there is a bearish correction happening in direction of broken level. It can be a good spot to open long position. Tenkan line as above Kijun and bullish Kumo is getting wider, in addition it is skewed strongly upwards.
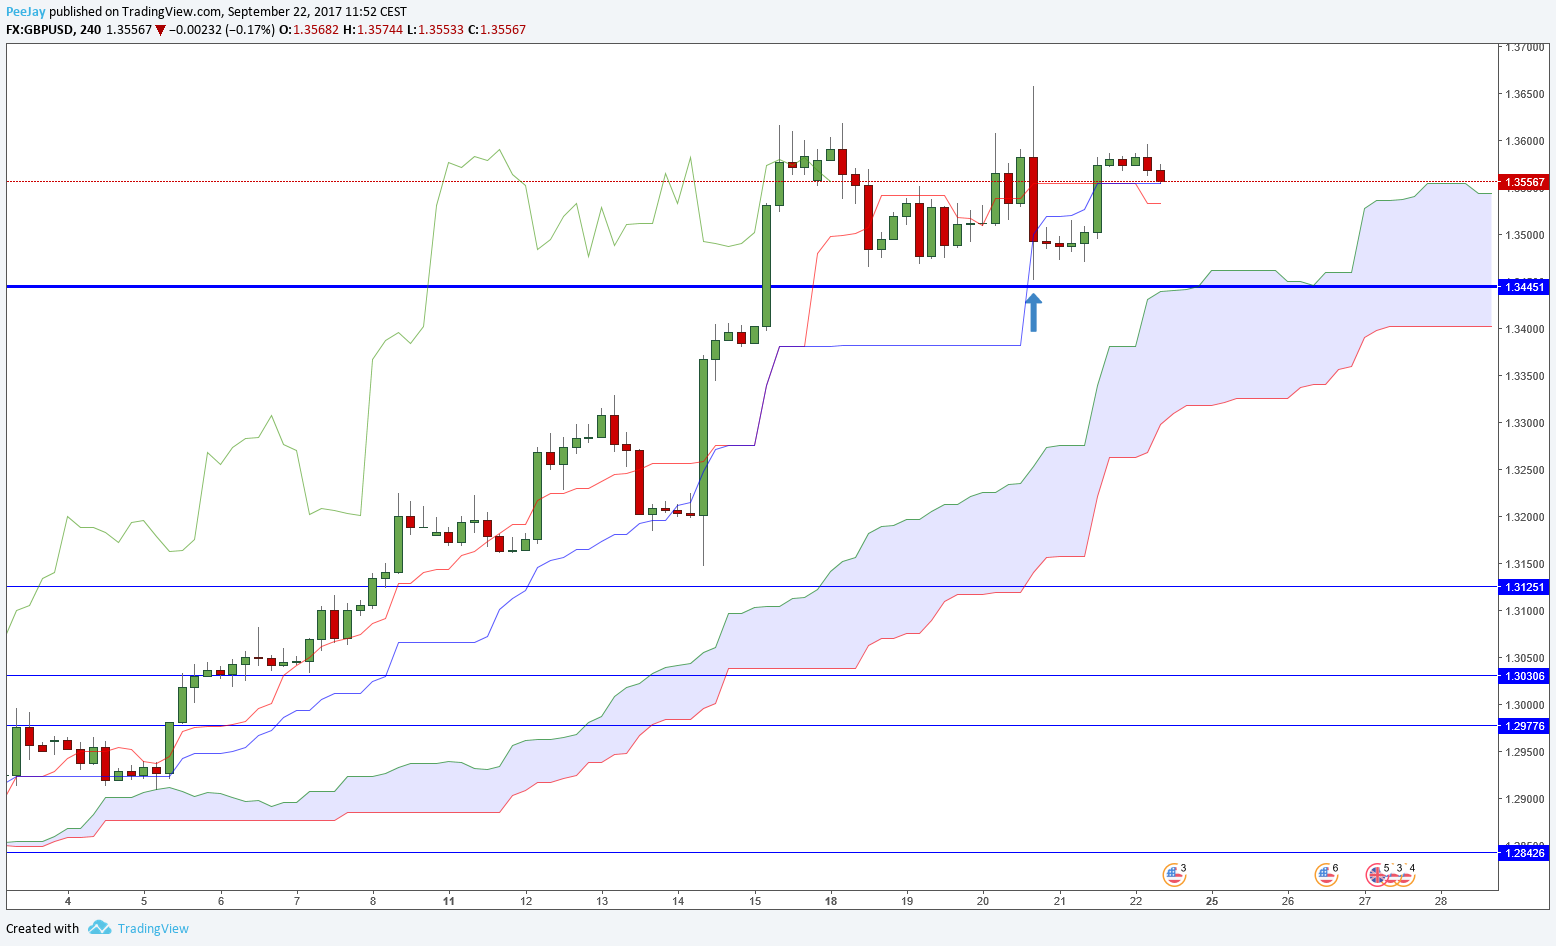
GBPUSD
After gains from yesterday’s evening GBPUSD is earning about 50 pips of profit already. Although we can see creation of bearish signal (Tenkan line is now below Kijun), but it is because of large marked arrow, which is some kind of big outside bar and will keep Kijun on this level until price will not break out of its range. We just have to wait for further development of this position. I opened this position with 24option broker, which offers fast order execution.


 Review")


