From Investor to Scalper is a cycle of analysis in which we take one financial instrument and the analysis includes a detailed look at the value from the monthly/weekly chart to the H1/M30.
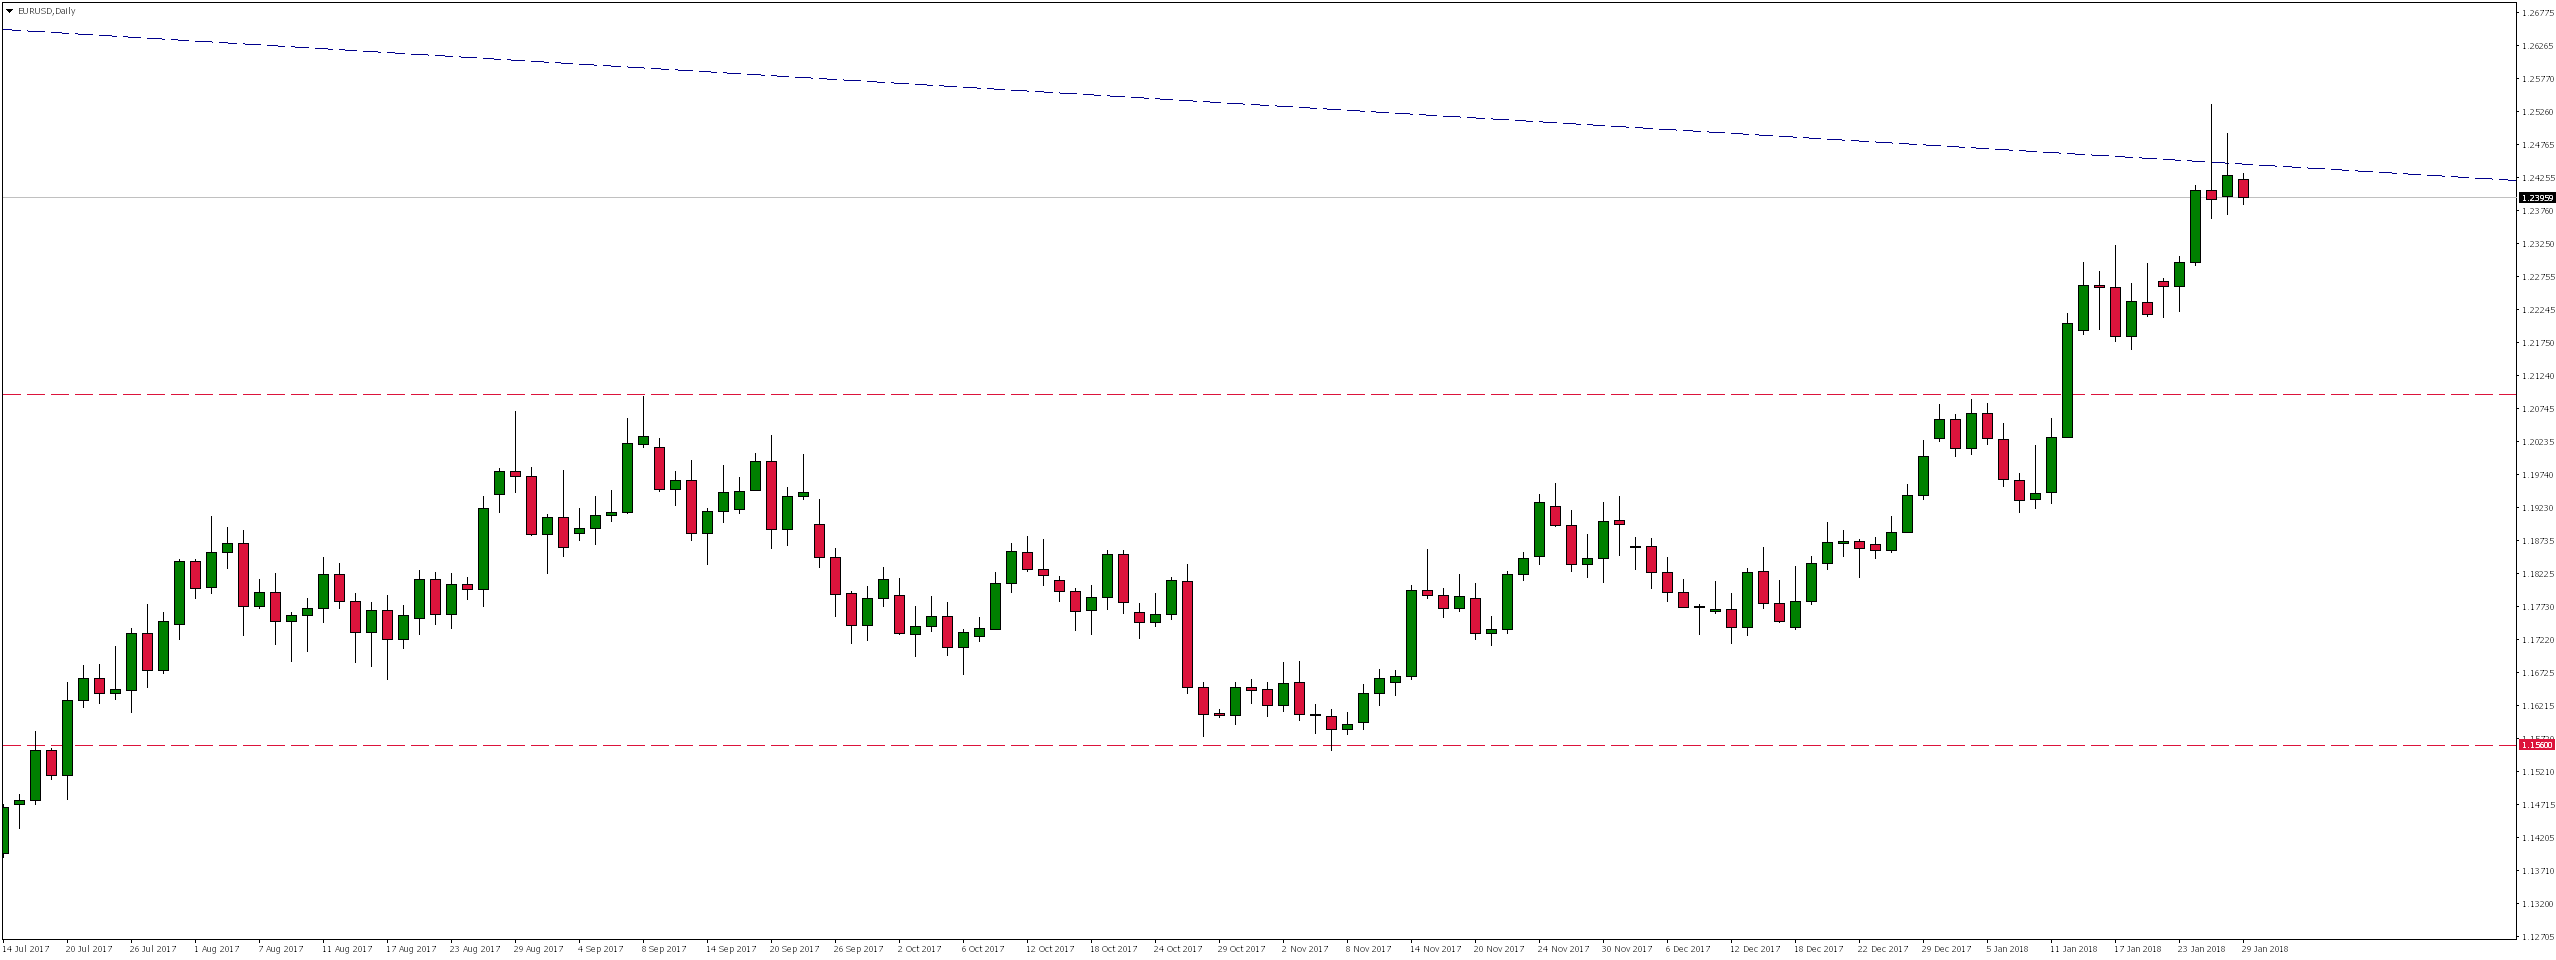
EURUSD as a result of continuous growth that lasted almost continuously since mid-December 2016, in July last year broke the top of lasting over 2.5 years consolidation and reached vicinity of 1.2100, where supply reaction appeared. It is also worth noting that although this level was already defeated in December 2014, it was only its first re-test. As a result of later declines, there was a re-test of the upper limit of the aforementioned consolidation, where a demand response appeared. Since then, we have been seeing increases again.
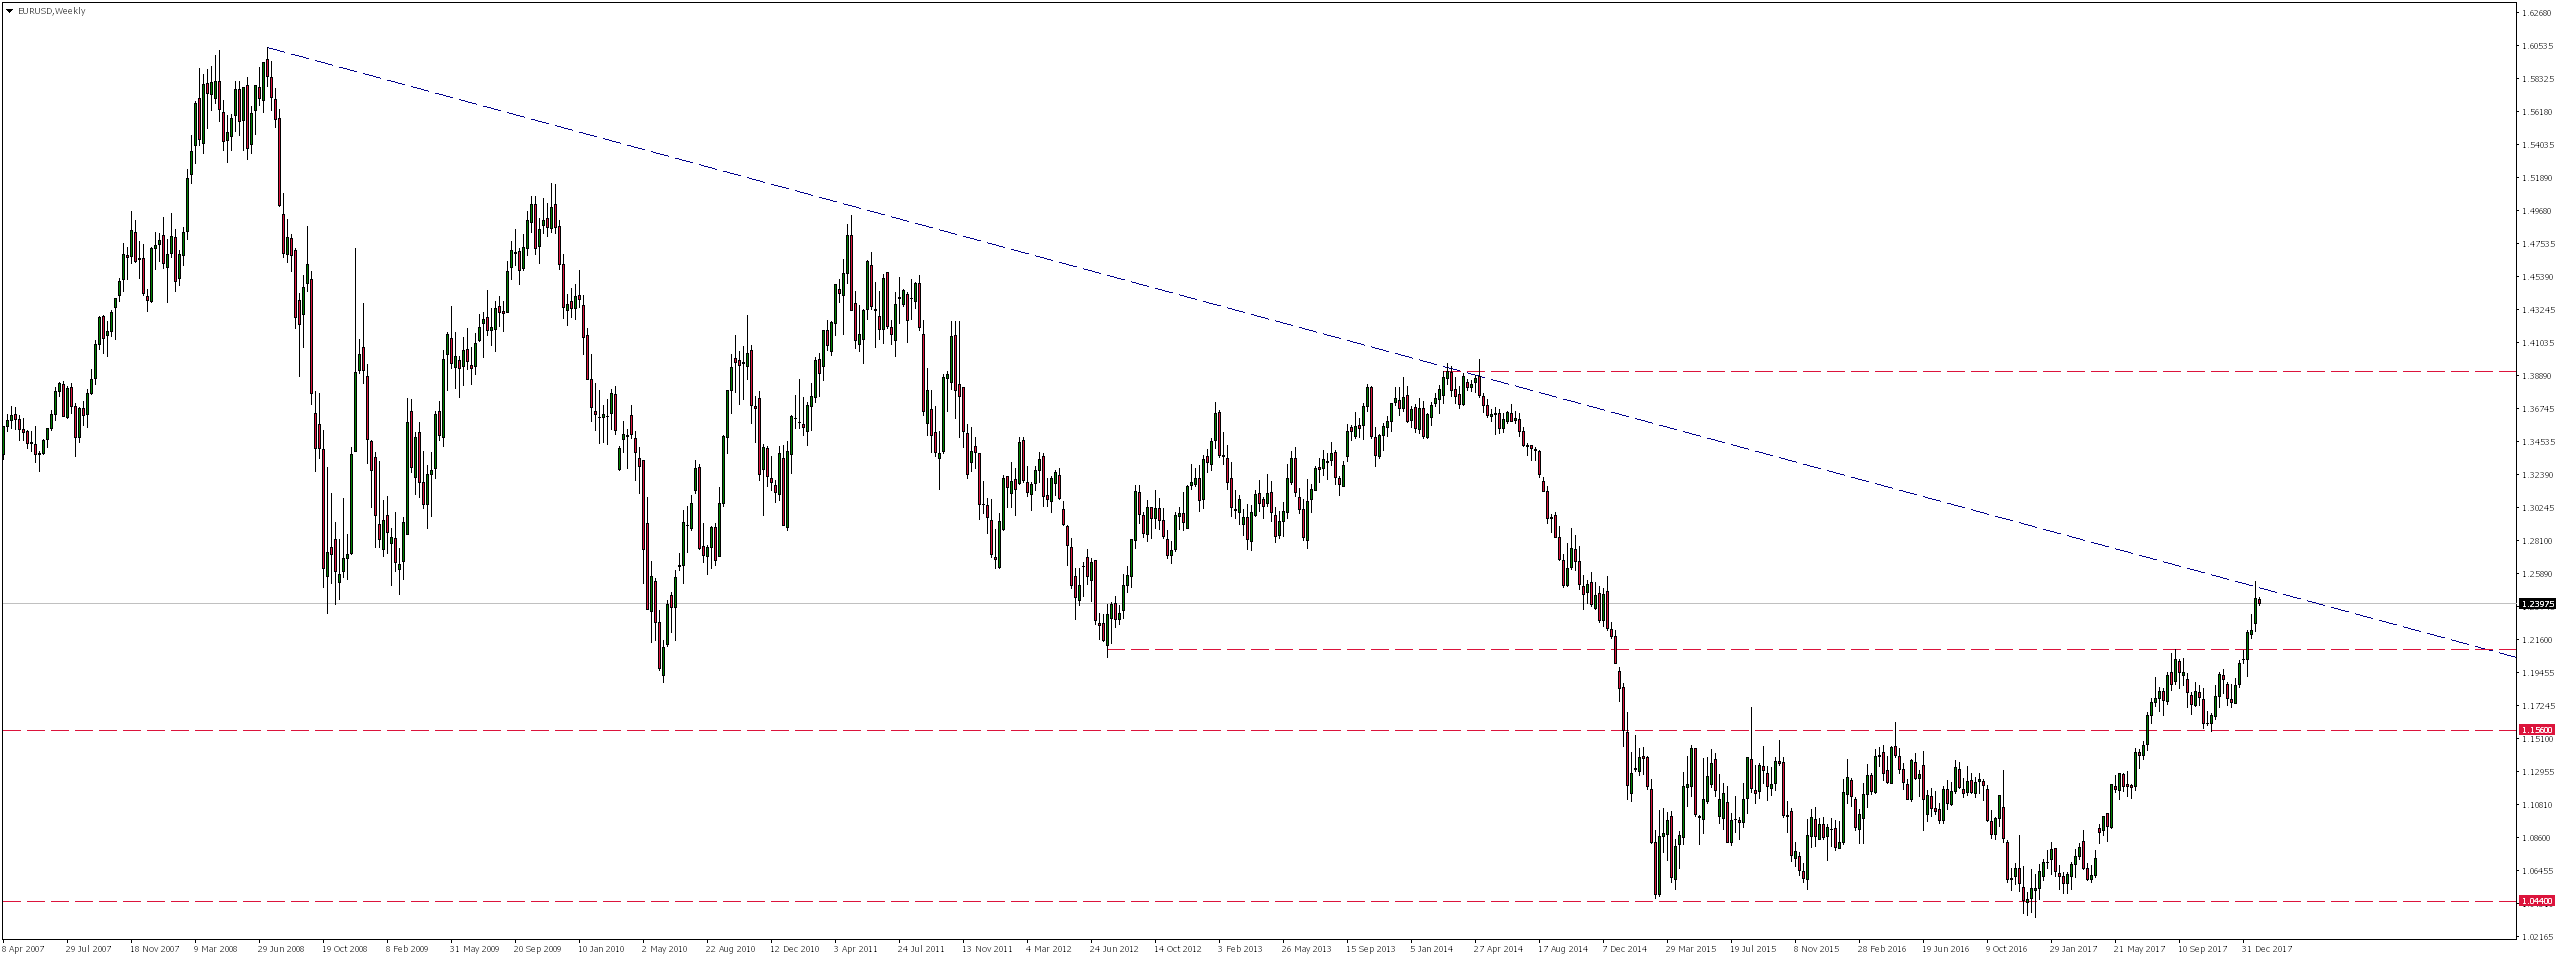
As a result of this appreciation, the eurodollar reached the downward trend line last week. It is worth noting that this resistance has never been permanently defeated in the past.
Error, group does not exist! Check your syntax! (ID: 4)
Considering Thursday’s and Friday’s supply reaction and the fact that the market still did not test the last defeated resistance 1.21 (now support), in the near future we could expect a rejection of this resistance and appearance of at least a downward correction. For this could happen, the course would have to overcome local support in the vicinity of 1.2370.
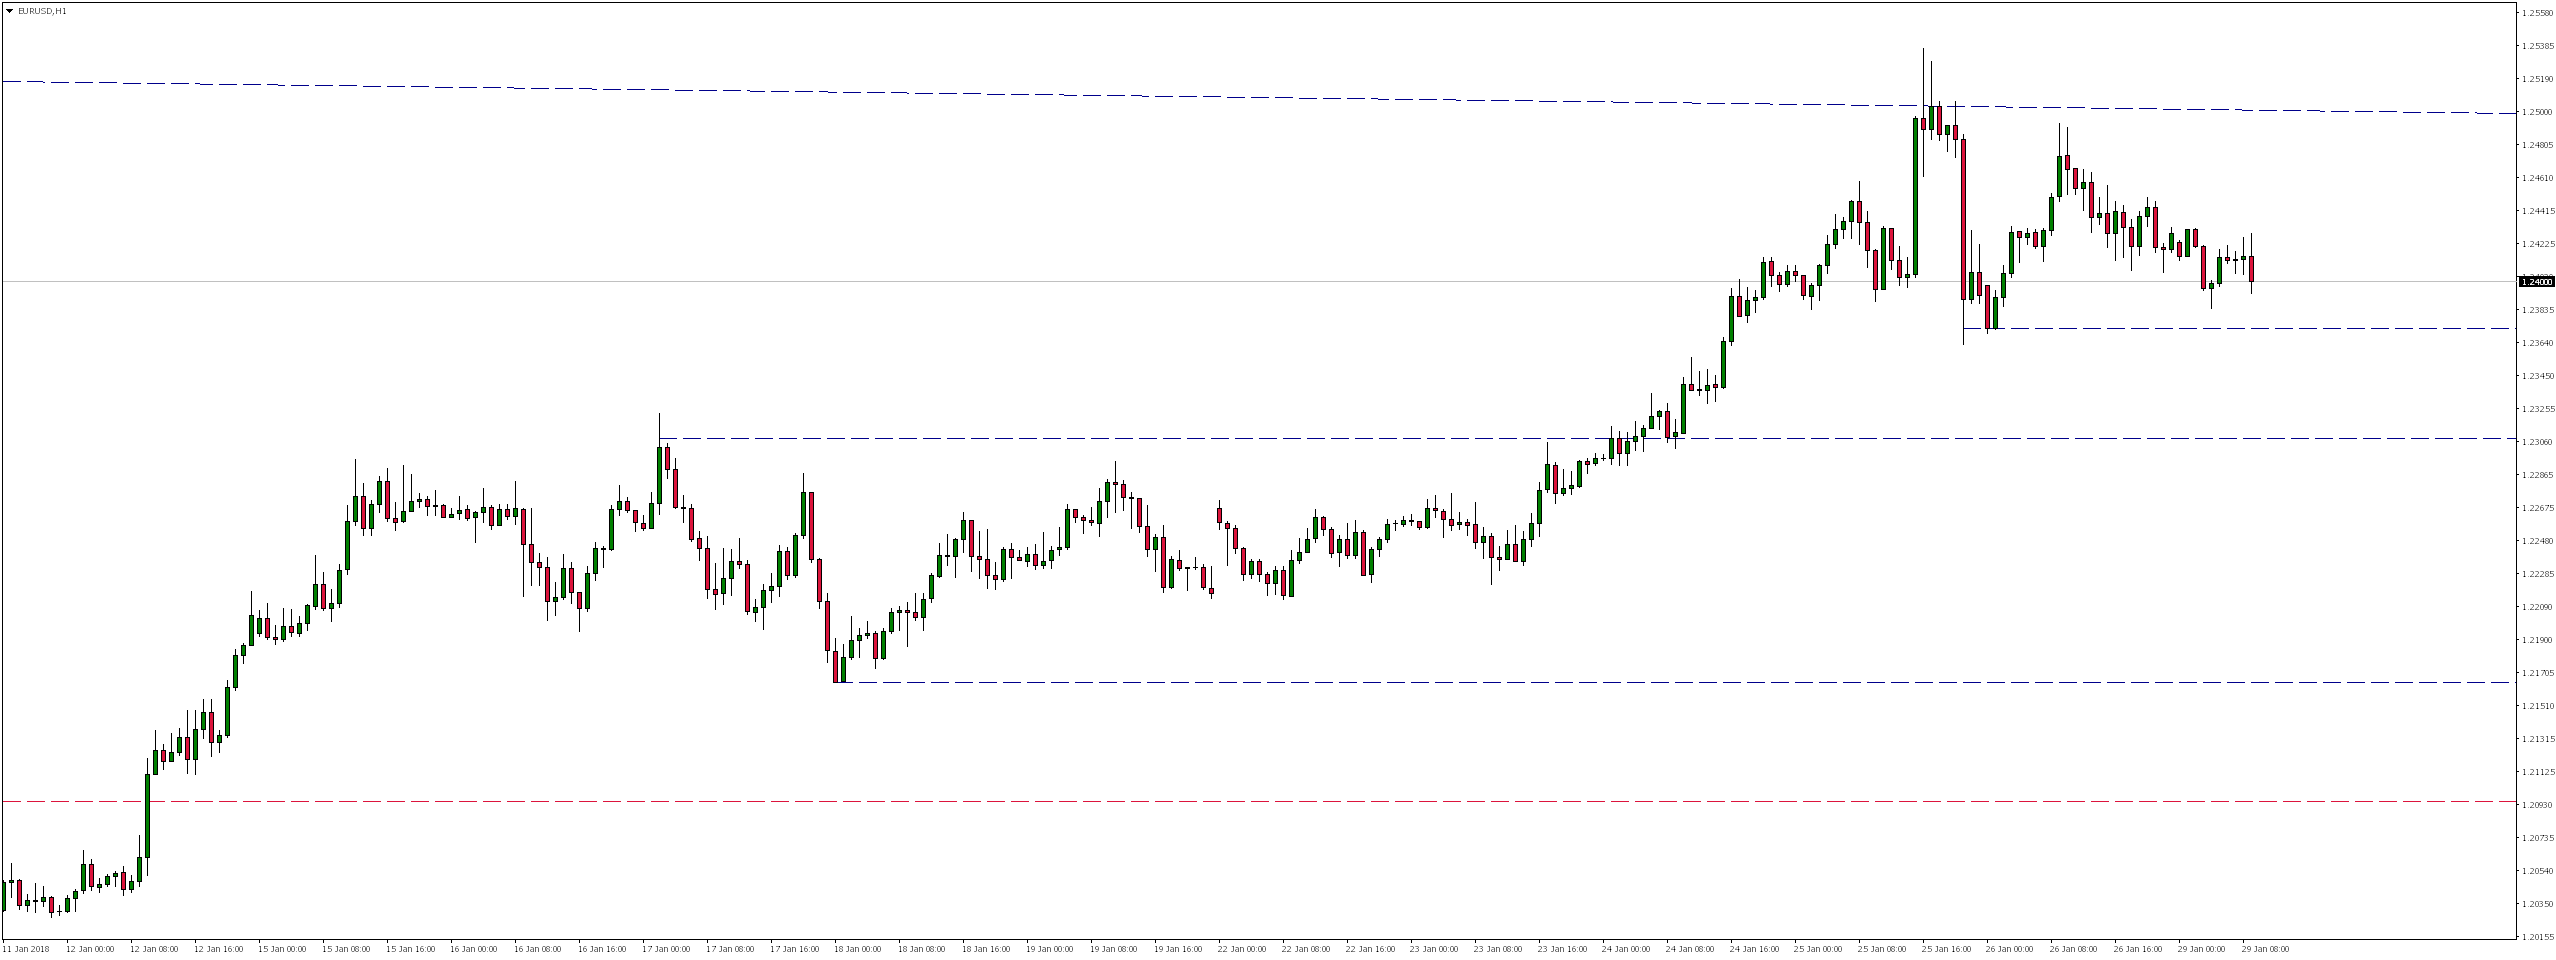
Even if the zone is permanently defeated, there are two other technical support levels on the way to the already mentioned level 1.21.


 Review")


