 Trading Inside Bars –under this heading you will find analysis made on basis of one of the most known Price Action formation – Inside Bar. Statistics show that best results gives breakout from Inside Bar formation on Daily chart, so mainly this time frame charts will be analysed.
AUDUSD broke the upper limit of Inside Bar created by daily candle from 7.06.
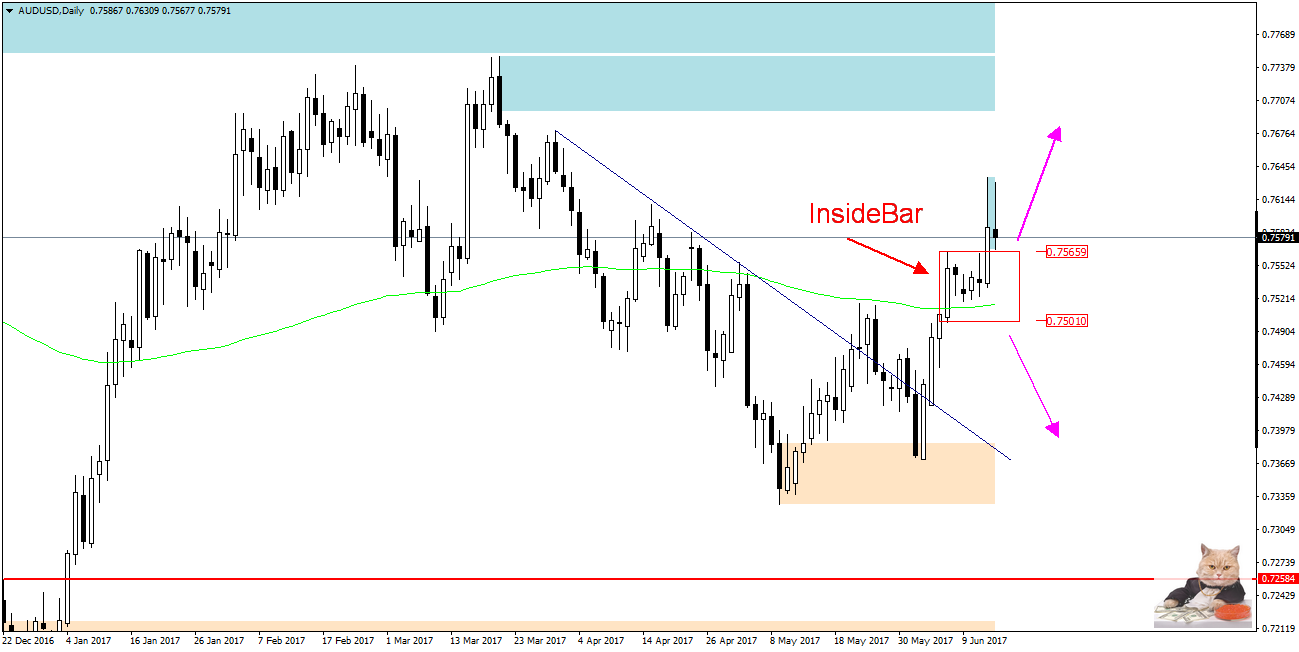
After Wednesday FOMC meeting ( rates up 0.25 in USA) the pair dropped from daily highs back to the top of IB, but after good data on Unemployment Rate released at 3.30 a.m. by the Australian Bureau of Statistics (change from 5,7 to 5,5% ) we have seen a dynamic growth however not as high as former bullish candle and now we observe AUDUSD testing the top of IB again.
If price returns back inside the IB there is a chance that we will see further declines to the resistance 0.7517 and further to the lower limit of the box at 0.7500 but on the way must break a strong resistance at 0.7565 but if this level stays unbeaten than we can expect growth even up to 0.7750.


 Review")


