Looking today (Sunday, 05.10) through the charts of various instruments, I have not found any that would meet the assumptions of my strategy (PA+MACD) and clearly indicate the direction it will take in the coming sessions.
Sentiment on USDCAD BUY/SELL 67%/33%
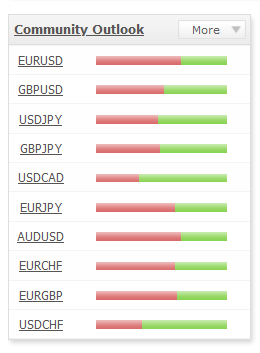 I decided to look at the sentiment in the market and among many currency pairs, one of them – USDCAD turned out to have unbalanced demand with supply – i.e. 33% short and 67% long.
And as we know from experience that on CDFs usually the majority (66%) is not right… that is, those betting on long positions will lose. I decided to take a closer look at this pair and check if it will be possible to confirm what the sentiment suggests.
As I mentioned at the beginning, none of the pairs met my strategy… I decided to look at the charts by examining them according to overbalance (OB) rules.
In short, it measures the largest upward correction in a downward trend and until it is overcome we consider the trend to be valid.
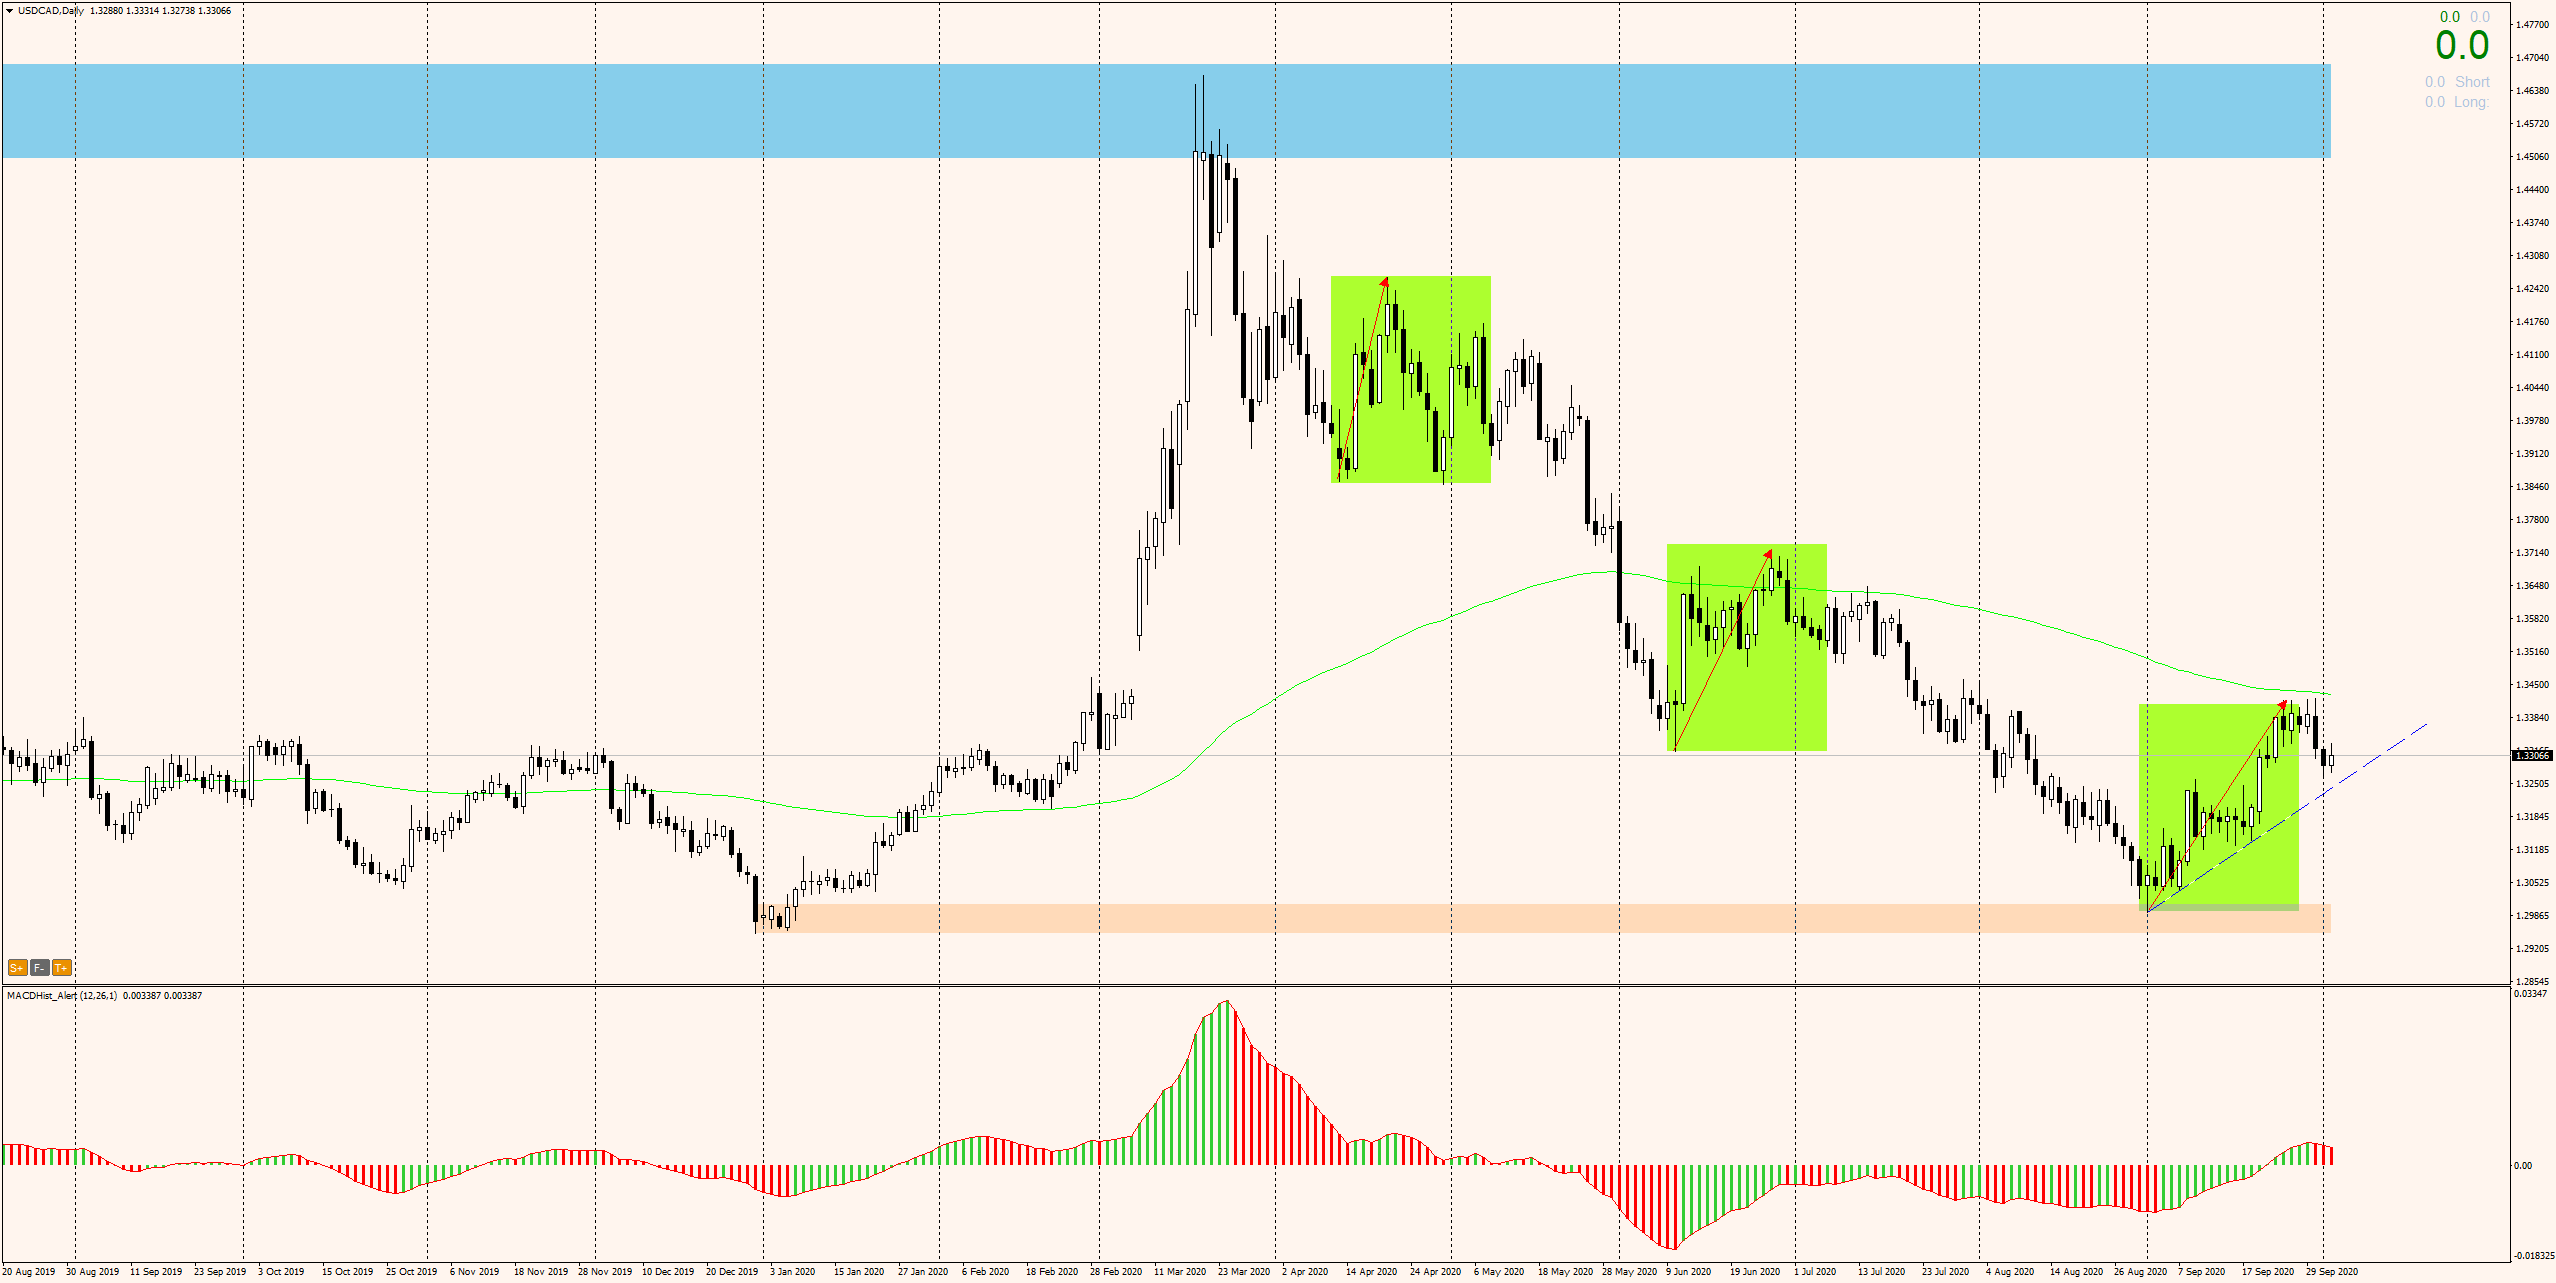
Looking at the USDCAD daily chart above, we see that since mid-March the price has been moving in a downward trend.
I have marked the largest upward correction = 412p so far with green rectangles. The last correction was slightly higher (8p) than the one measured so far. However, for 5 days in a row, the price was unable to stay above the edge of the rectangle, which may signal weakening demand and continuation of declines.
visit my channel : ongoing analysis https://t.me/TradewithDargo
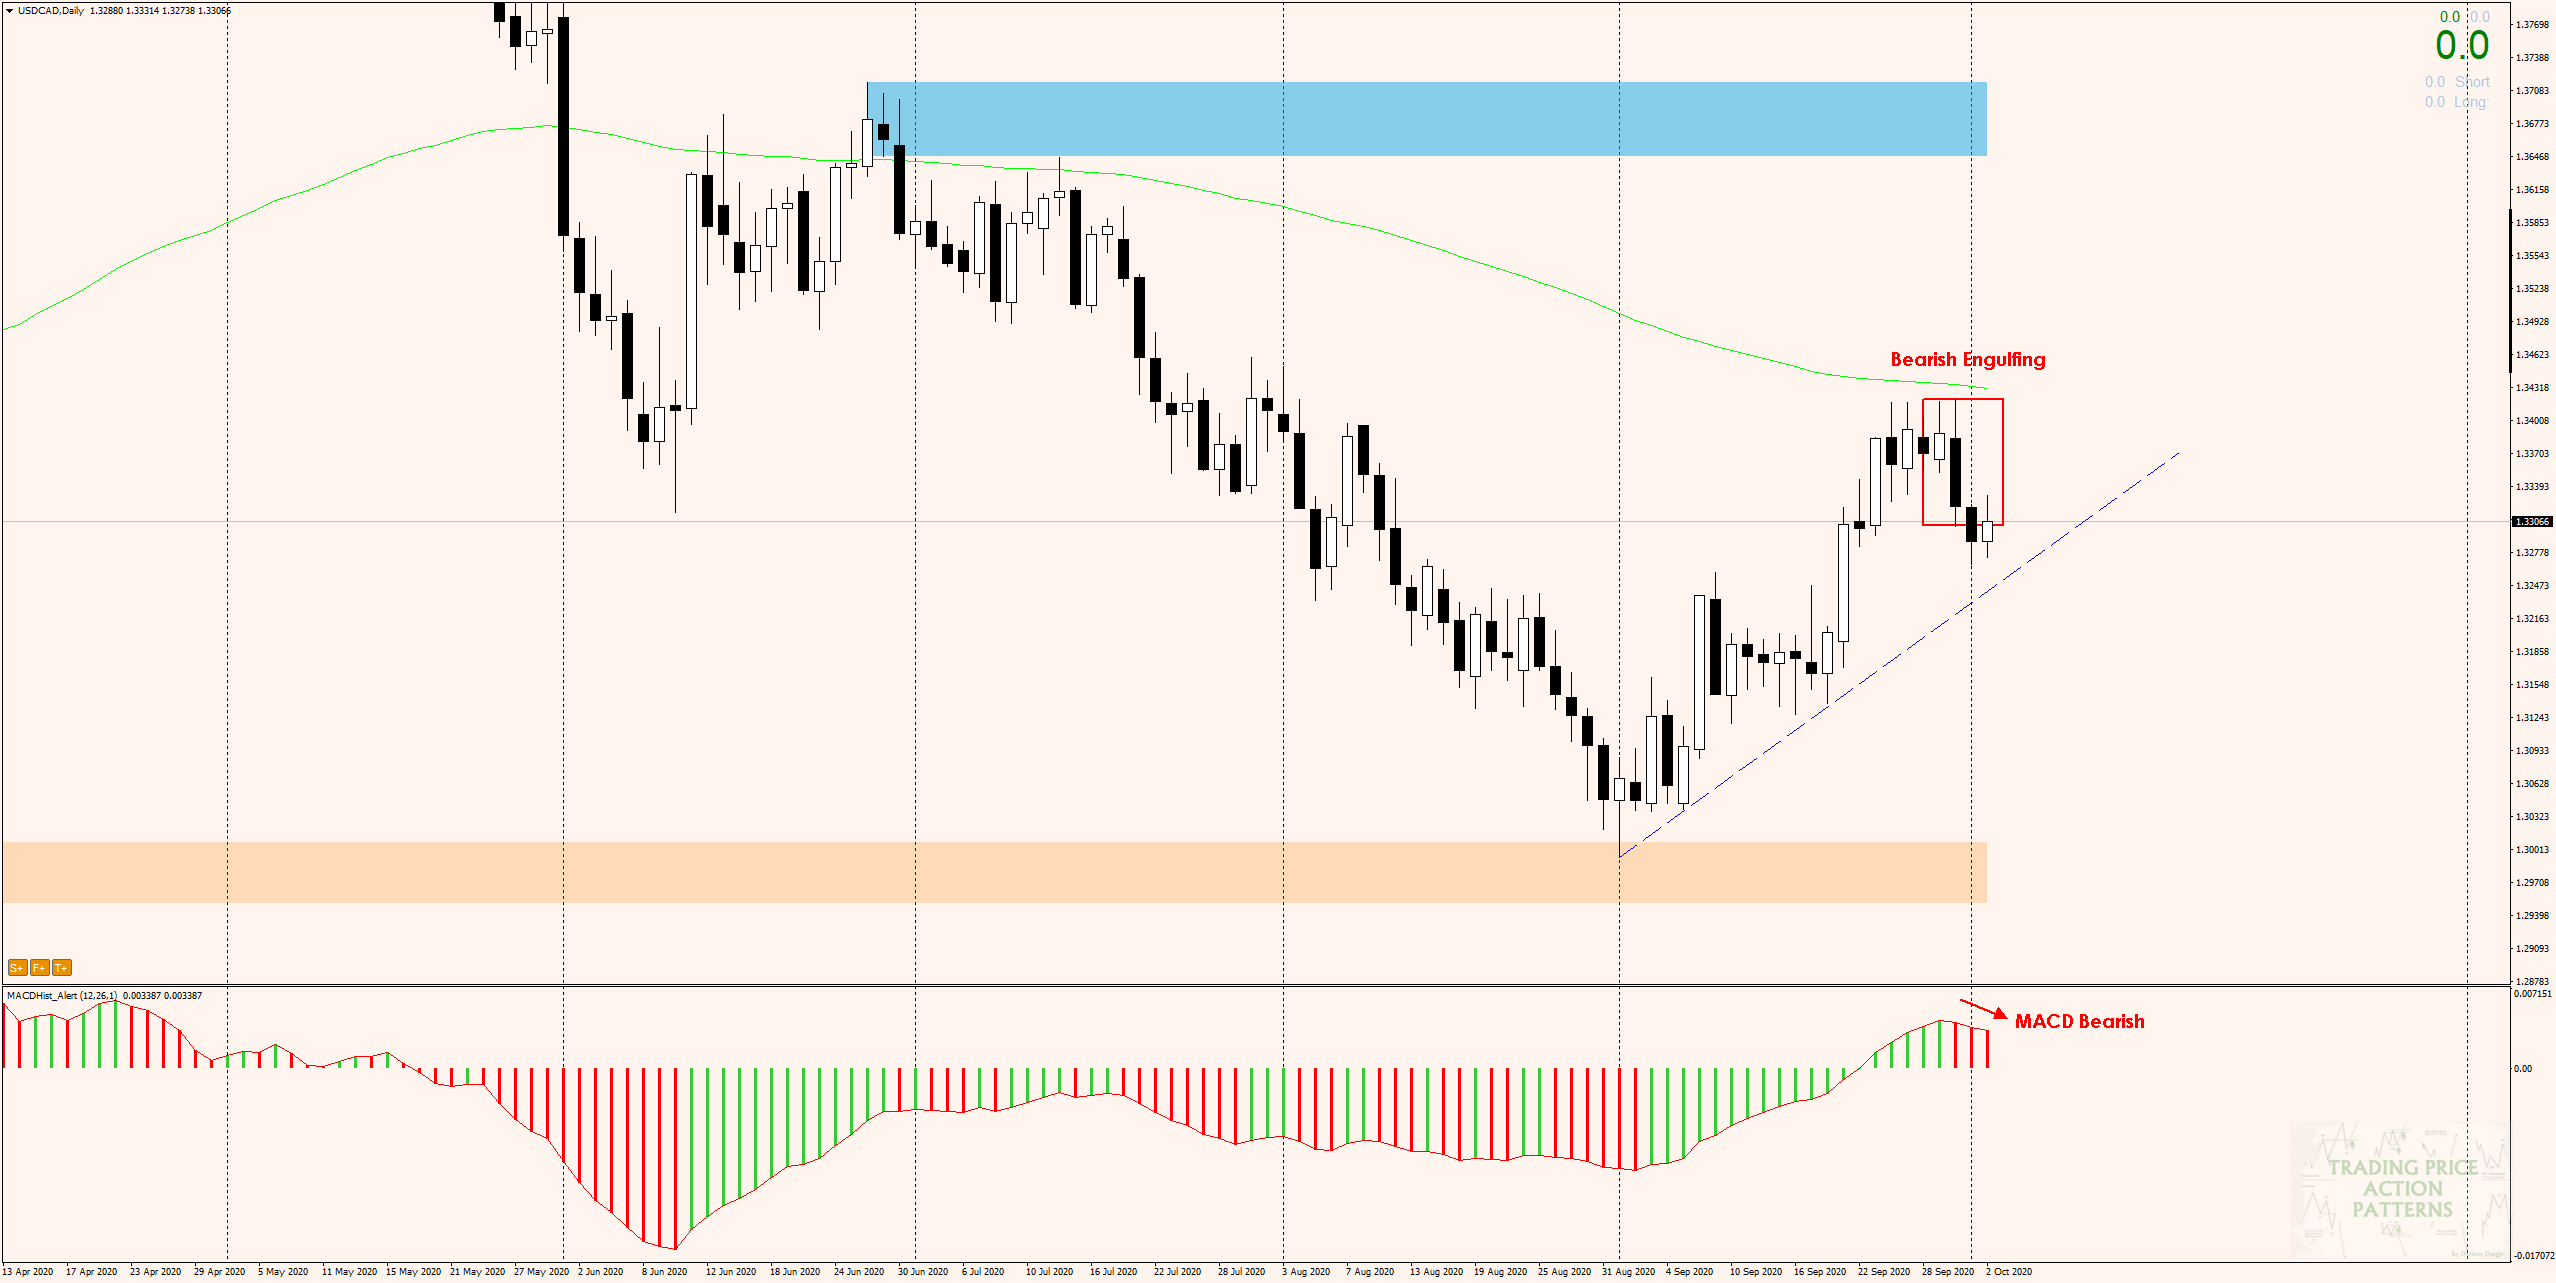
It is also worth looking at the daily chart from the typical Price Action point of view. The last candle of September covered the preceding candle, creating a bearish engulfing pattern. On the next day, the price is breaking out of the formation causing a change of direction from MACD to downward. This can also confirm the end of the correction and the return to the main trend and the continuation of declines. For the declines to take on a larger size, the price must cross the local trend line (dashed blue).
I recommend:
- Trading with PA+MACD, way to increase the probability of winning
- Trading based on EMA144
- ongoing analysis https://t.me/TradewithDargo
 In our Facebook group, which you can join anytime: https://www.facebook.com/groups/328412937935363/ you will find 5 simple strategies on which my trading is based. There, every day we post fresh analyses of currency pairs and commodities. You can also visit my channel where I post my trading ideas: https://t.me/TradewithDargo


 Review")


