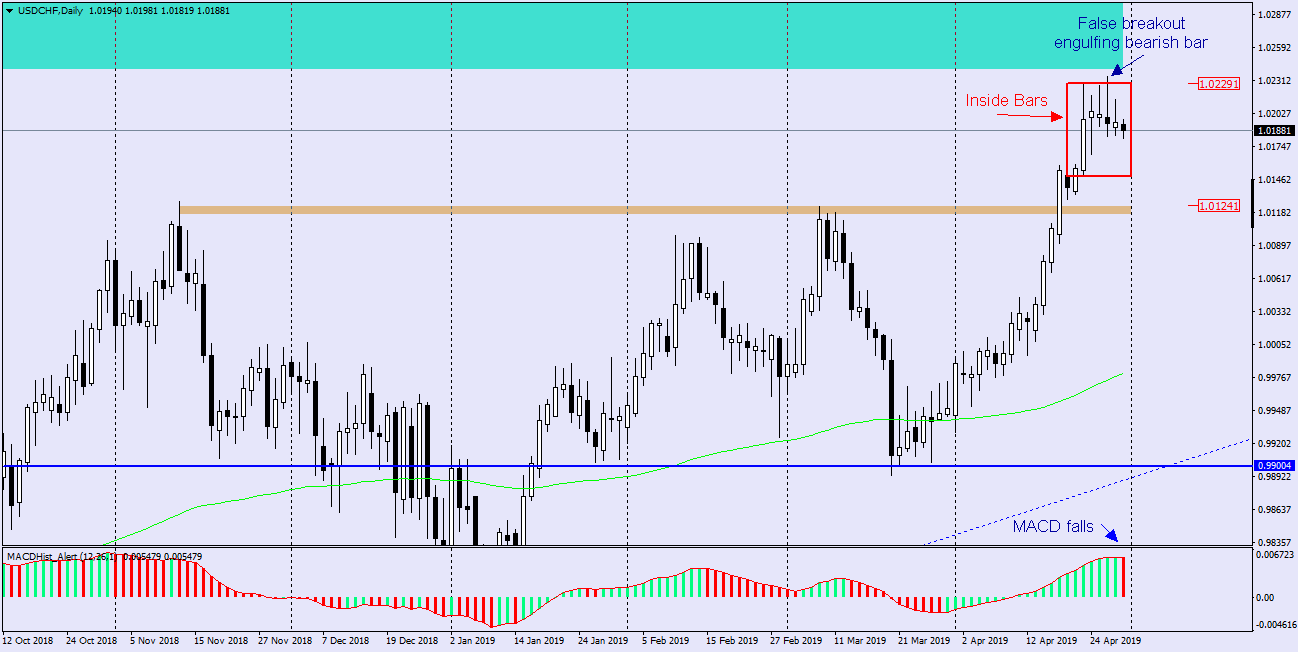
USDCHF – daily candle from 23.04 created Inside Bar formation, because for the next two days the quotations were not able to overcome its extremes. Although the 26.04 quotations surpassed the upper IB limit, setting the maximum for this year, at the end of the day price returned to the inside of the formation, pointing to the so-called false breakout, creating an additional pattern – bearish engulfing.

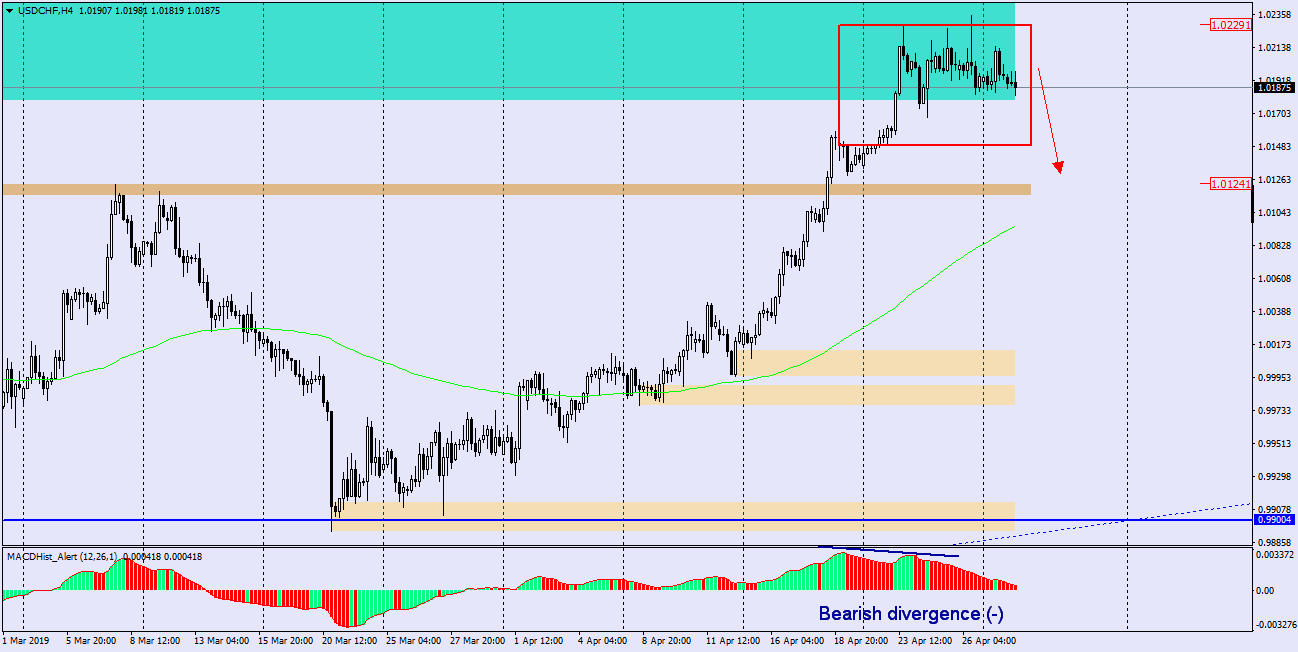
In the chart H4 below we can see that the price is still within the IB range, but the bearish divergence in the MACD increases the probability of breaking out thru the IB bottom and the target for supply may be the nearest support starting at the level of 1.0124.

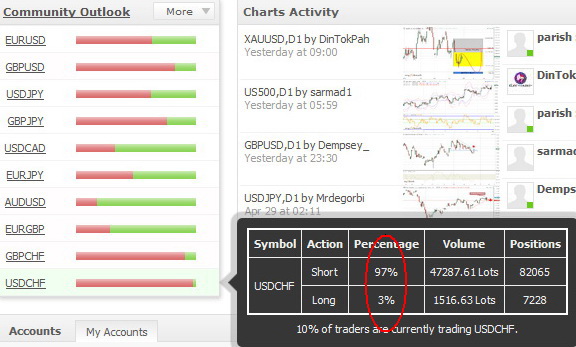
Edited 01.05.2019 : situation is getting hot… continuation of the move from yesterday, sentiment unbalanced sell/buy 97:3. declines can be dynamic when the Inside Bar is broken thru the bottom
 Join us in our Price Action Patterns group for serious traders, get fresh analyses and educational stuff here: https://www.facebook.com/groups/328412937935363/


