Since the beginning of 2017 the USDJPY pair has been moving in a downward trend, which has taken the form of a 1100p high downward channel. The support of the channel connects the minimum from 2018 and 2020, while the resistance has been tested several times, the last time on 23.03.2012.
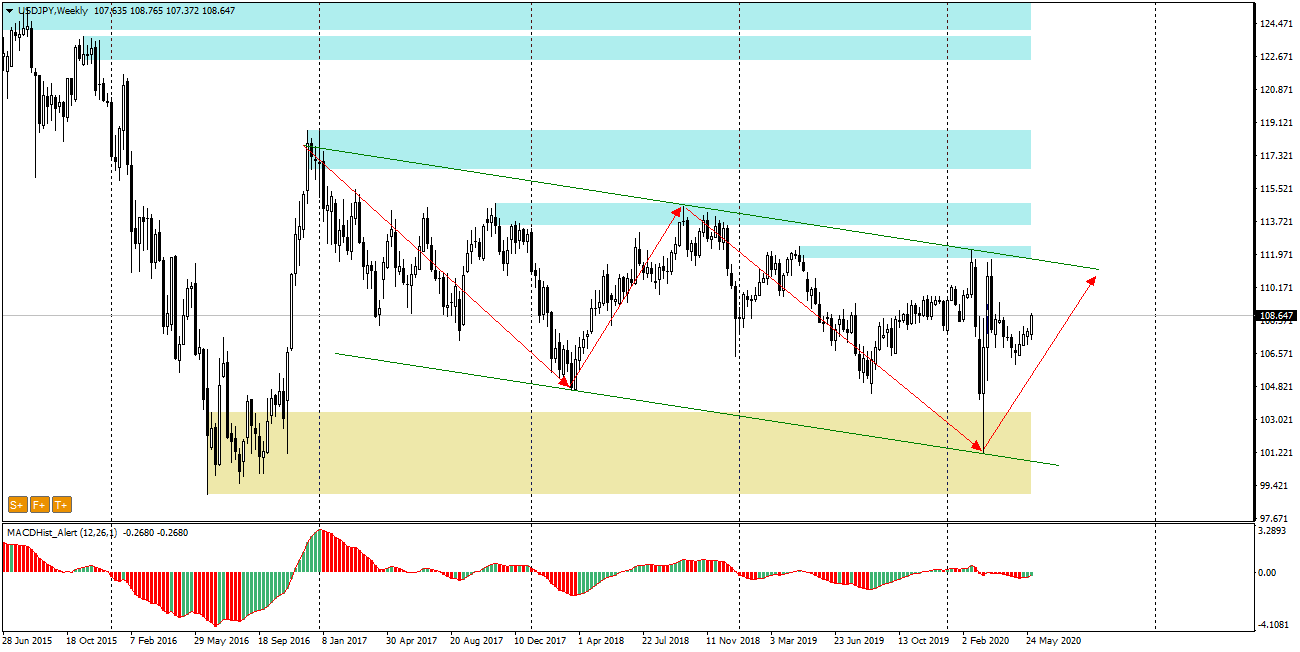
Overall, there is a noticeable optimism in the stock market and an increase in risk appetite – risk-on, which is usually accompanied by a weakening Jen being a safe haven in difficult times.
Today we witnessed a strong breakout from the two-week narrow consolidation (Chart H4). The daily candle reached a size of 130p which, compared to the consolidation size of about 50p, can be a signal for more sustained increases.
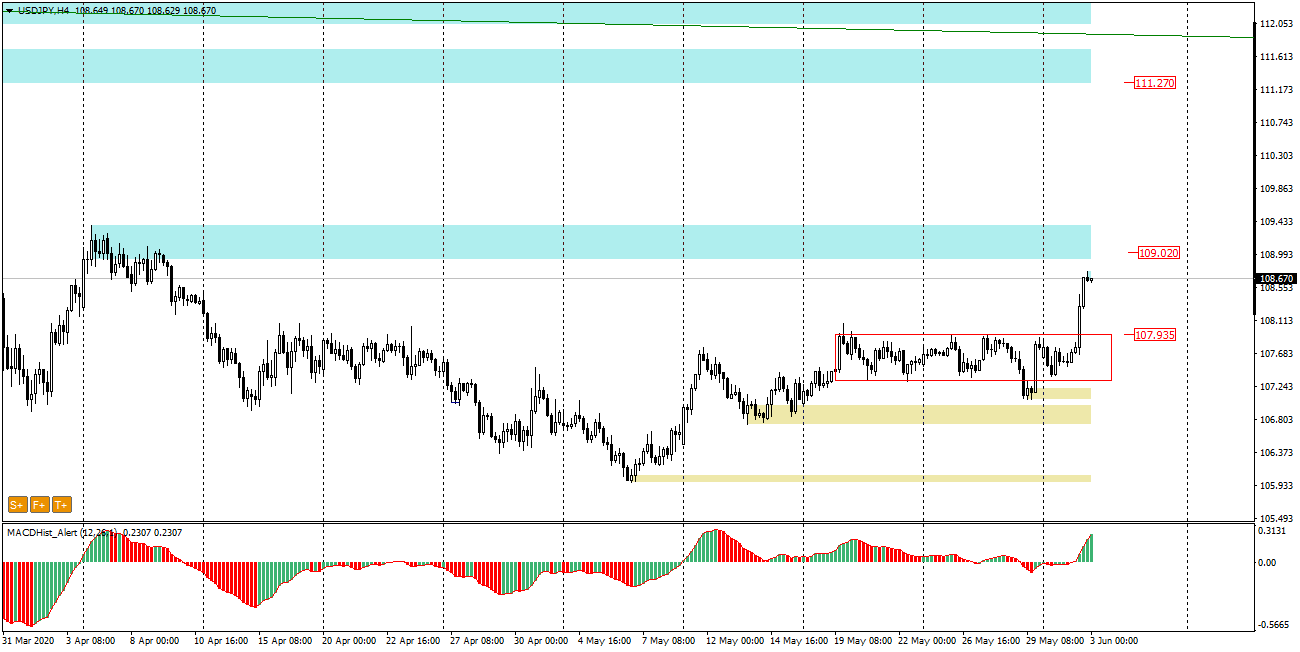
The first target will be the nearest supply zone around 109.00.
If the quotations will permanently overcome this zone, the next target is much higher, at 111.20.
A reasonable level to take the long position seems to be the area 108.30-40, if there is a correction of today’s increases and the price appears in this area.
A negation of the growth scenario will be a return of price to the inside of the consolidation, which currently seems unlikely.
You can see me trading live every day from Monday to Friday between 1 p.m. and 2 p.m. (London time). During the live sessions I make analysis and show how I trade according to my strategies, I will also answer to your questions in the chat room. All you need to watch my live sessions is enter here: https://www.xm.com/live-player/intermediate
In our Facebook group, which you can join anytime: https://www.facebook.com/groups/328412937935363/ you will find 5 simple strategies on which my trading is based. There, every day we post fresh analyses of currency pairs and commodities


 Review")


