 When it comes to technical analysis in Forex trading, there are dozens of different indicators and methods of utilizing them. Among this lengthy list, we have two very famous ones: Fibonacci and Wave Analysis.
The first one was invented back in the 13th century. During that time an Italian inventor named Leonardo Fibonacci came up with the so-called ‘golden ratio’ of 0.618. In modern finance, analysts use not only 61.8% level, but also 23.6%, 38.2%, and 78.6%. To make it easier to understand, let us take a look at this diagram:
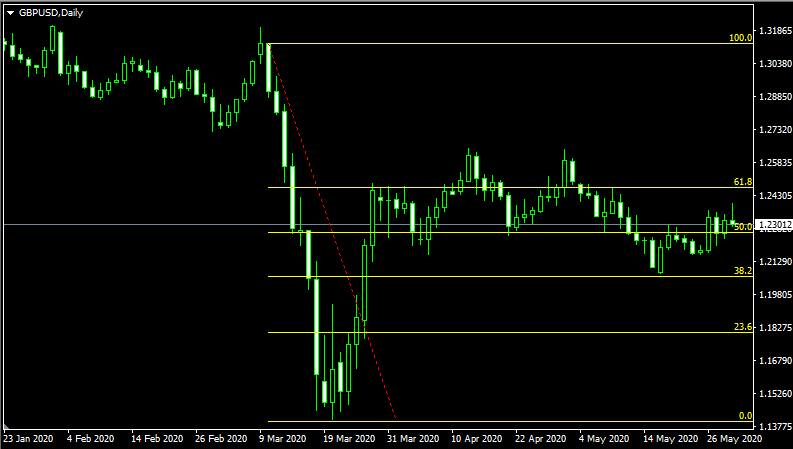
As we can see from the chart above, in order to conduct Fibonacci analysis, we have to first find one large downside or upside move. Then the second stage involves drawing 6 lines. The percentage on the yellow line measures the distance between the recent peak and bottom. The main idea behind this analysis is that those yellow lines will often provide significant support and resistance levels.
We can see that this was the case during recent price action in EUR/USD pair. For example, the 61.8% level was proven to be a major resistance area. In fact, we have 3 instances, when the spikes into this area were rejected and the price came down. At the same time, 38.2% offered a reliable support area for the Euro.
The use of this type of analysis is quite widespread. Recently, even Bloomberg used Fibonacci levels to analyze the recent stock market moves.
This method is different from Forex wave analysis by a huge margin. During the 1930s, Ralph Nelson Elliott invented his own theory, which stated that the markets moved in repetitive patterns. According to his works, this involved 5 waves moving towards the direction of the main trend. This would be followed by 3 waves as part of the correction. The timeframe of each of those moves can be different, however, the 5-3 pattern remains intact.
For more details on how those two types of analysis work, one can visit Elite CurrenSea and view their take on wave analysis.
Use of Fibonacci and Elliott Wave Analysis
Obviously, a trade can use each of those types of analysis in isolation. However, they do fill out each other’s imperfections, so it might be a better idea to combine Fibonacci and Elliott Wave analysis for better accuracy and understanding.
So why is this the case? Well, firstly it might be helpful to keep in mind that the former method, invented by Leonardo Fibonacci is most helpful in identifying strong support and resistance points. However, its main weakness is that it does little to predict the direction of the trend and that of the future moves of the given currency pair.
On the other hand, Elliott Wave analysis can be more helpful with that regard. Using this method, very often traders can identify the direction of future moves. The problem here is that this type of analysis does not specify the points where there can be reversals. Market participants who use this method can predict the direction of the trend and place trades accordingly. However, they will have predictable questions: When this move is going to end? Where are the important support and resistance levels? So in most cases, they do not have answers.
In conclusion, it is better for Fibonacci and Elliott Wave analysis to be used together. This can help traders to come up with more accurate analysis and predictions.


 Review")


