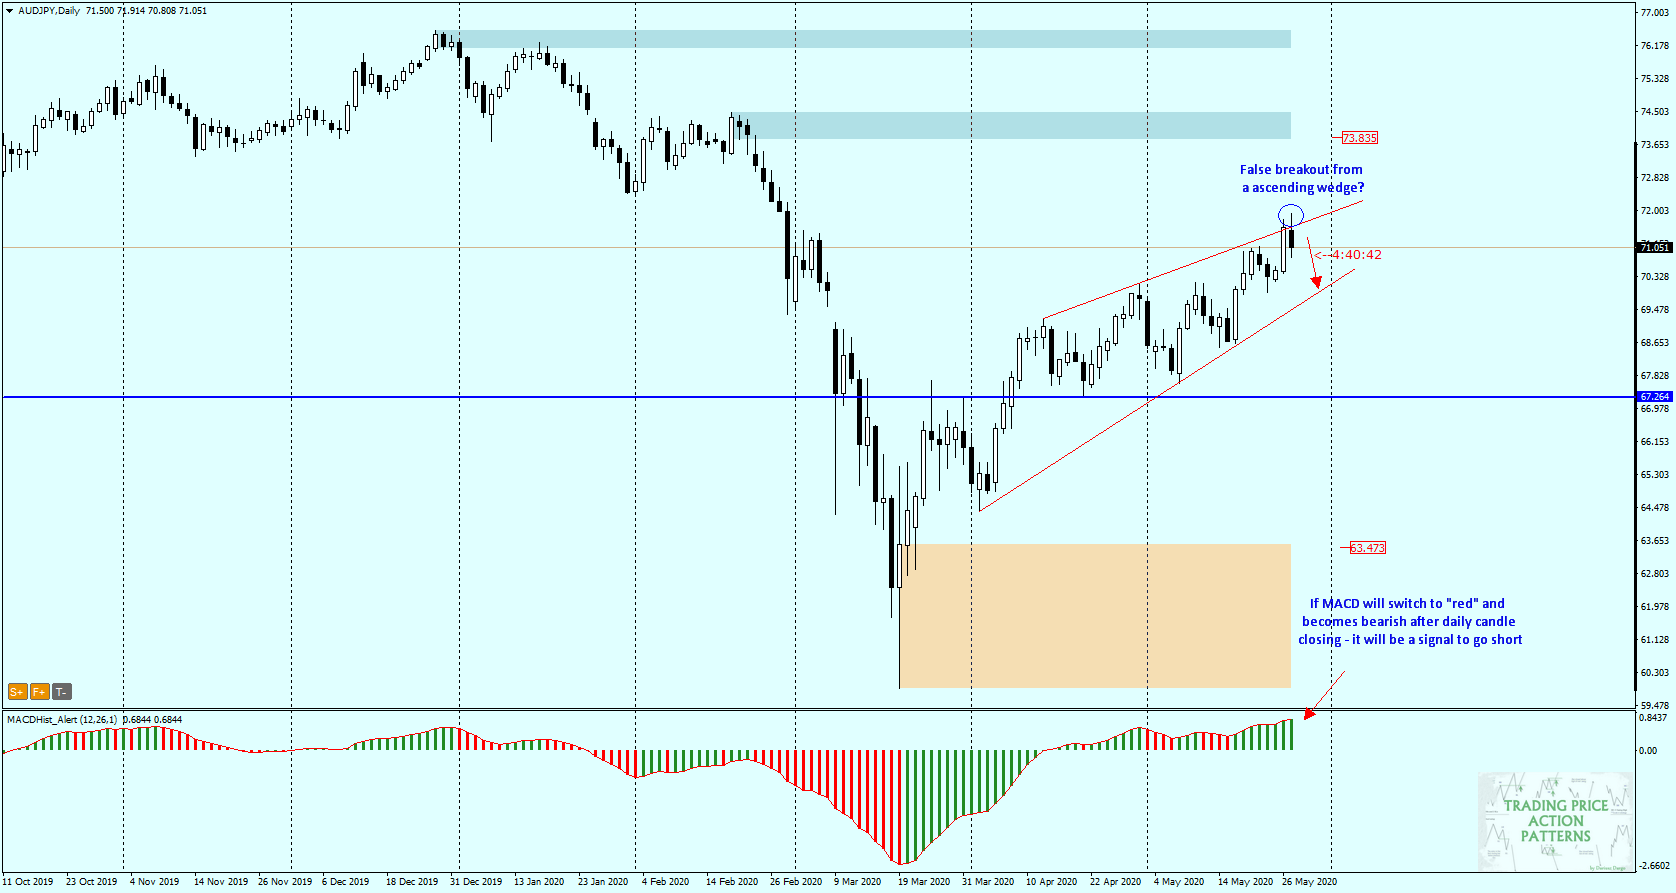
The AUD/JPY pair has been moving in an upward, downward trend since early April.
The quotations are in an easily recognizable formation – ascending wedge.
Today, after an attempt to overcome the resistance of the formation, the quotations have returned to its interior. The unsuccessful top-notch formation formed a candle on the H4 chart, whose top wick protrudes above the resistance, while the body is completely below it. At the same time a downward divergence appeared on the MACD.
You can see me trading live every day from Monday to Friday between 1 p.m. and 2 p.m. (London time). During the live sessions I make analysis and show how I trade according to my strategies, I will also answer to your questions in the chat room. All you need to watch my live sessions is enter here: https://www.xm.com/live-player/intermediate
It is highly probable that the declines will continue towards the wedge support.
A good confirmation for this bearish scenario will be the appearance of a maximum on the MACD and the transition of the oscillator into the downward phase.
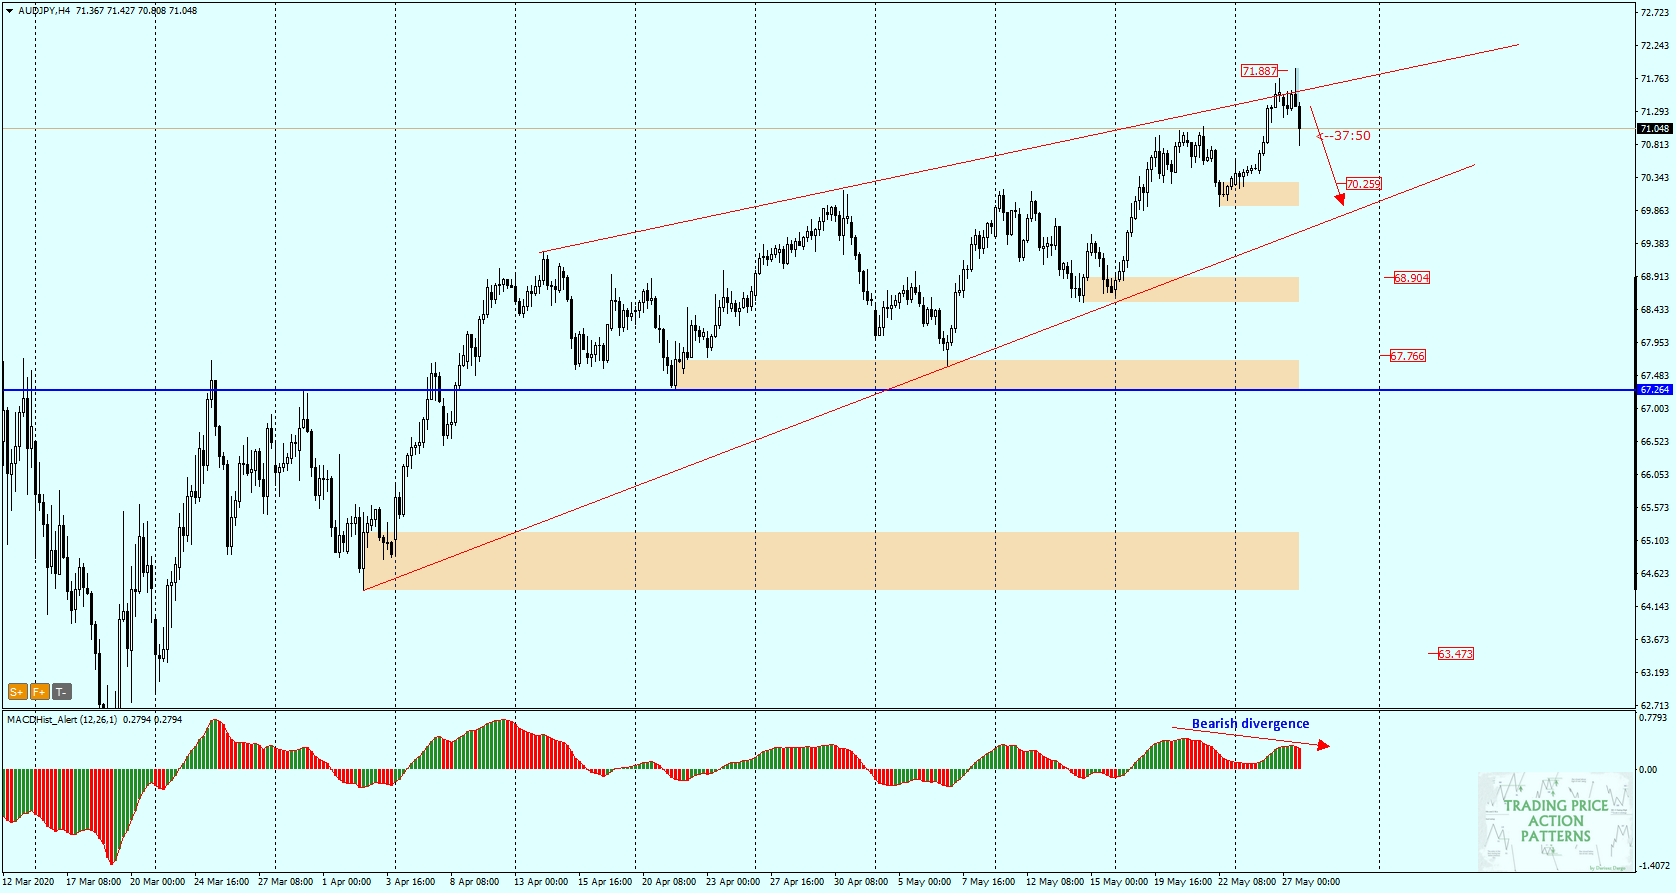
If, after the New York session is closed, appears a lower bar on MACD (lower than the previous one (red)) – this will be a strong signal to take the SELL position. The first supply target will be at 70.25 demand zone and in case of overcoming it the wedge support.
Only breaking the last high at 72.00 can change the scenario to bullish.
In our Facebook group, which you can join anytime: https://www.facebook.com/groups/328412937935363/ you will find 5 simple strategies on which my trading is based. There, every day we post fresh analyses of currency pairs and commodities


 Review")


