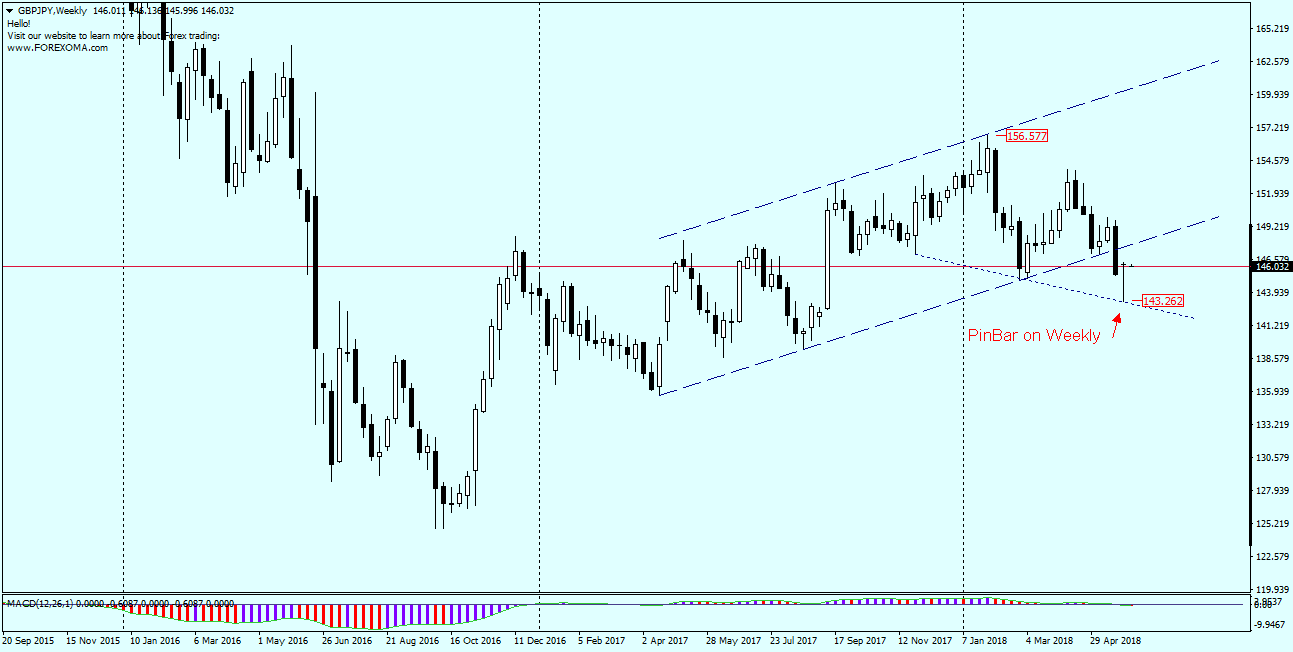
Recent analyzes of this pair have proved to be quite accurate, and the situation on the chart at the end of last week encourages further interest in this pair. On the weekly chart, a pin bar appeared, the minimum of which (143.20) coincides perfectly with the downward trend line run on the minima of November 28, 17 and 02.03 (dotted blue line).
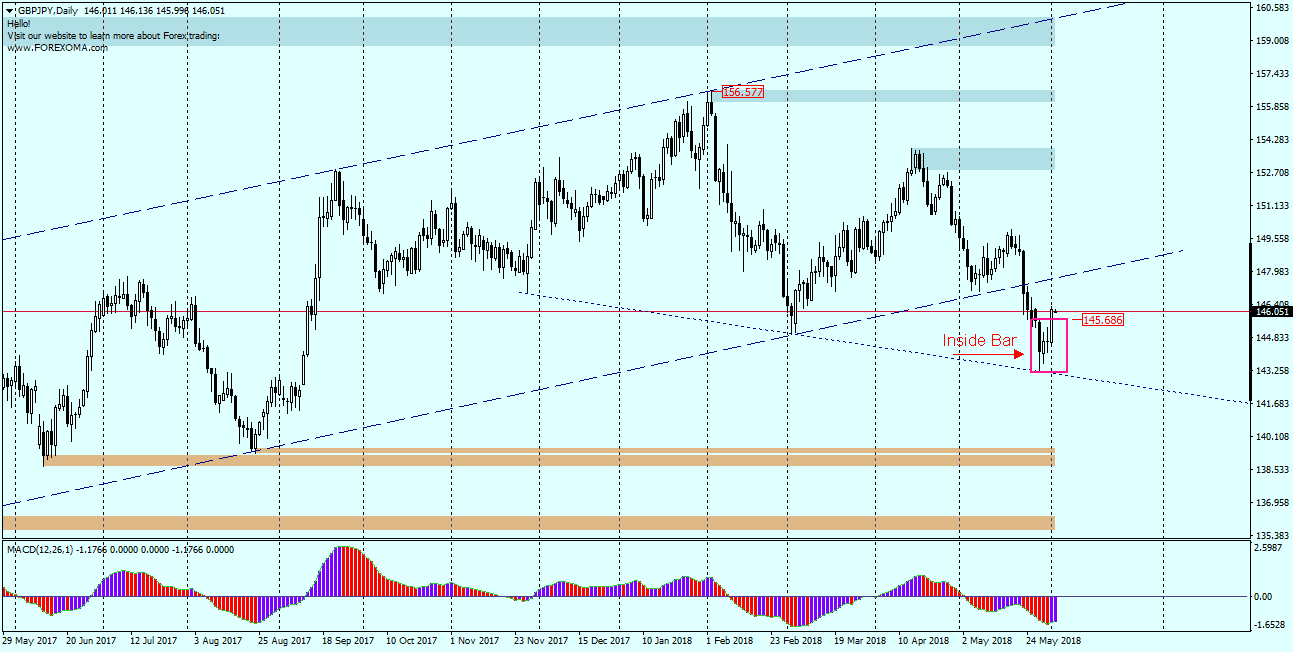
On the Daily chart, we see that the GBPJPY left the top of described in the previous analysis Inside Bar and went north. If we look at the current situation in terms of the PA+MACD strategy, this break is accompanied by the “desirable” change on the MACD oscillator – it starts to grow which supports me in the statement that we can expect increases in the upcoming sessions on this pair.
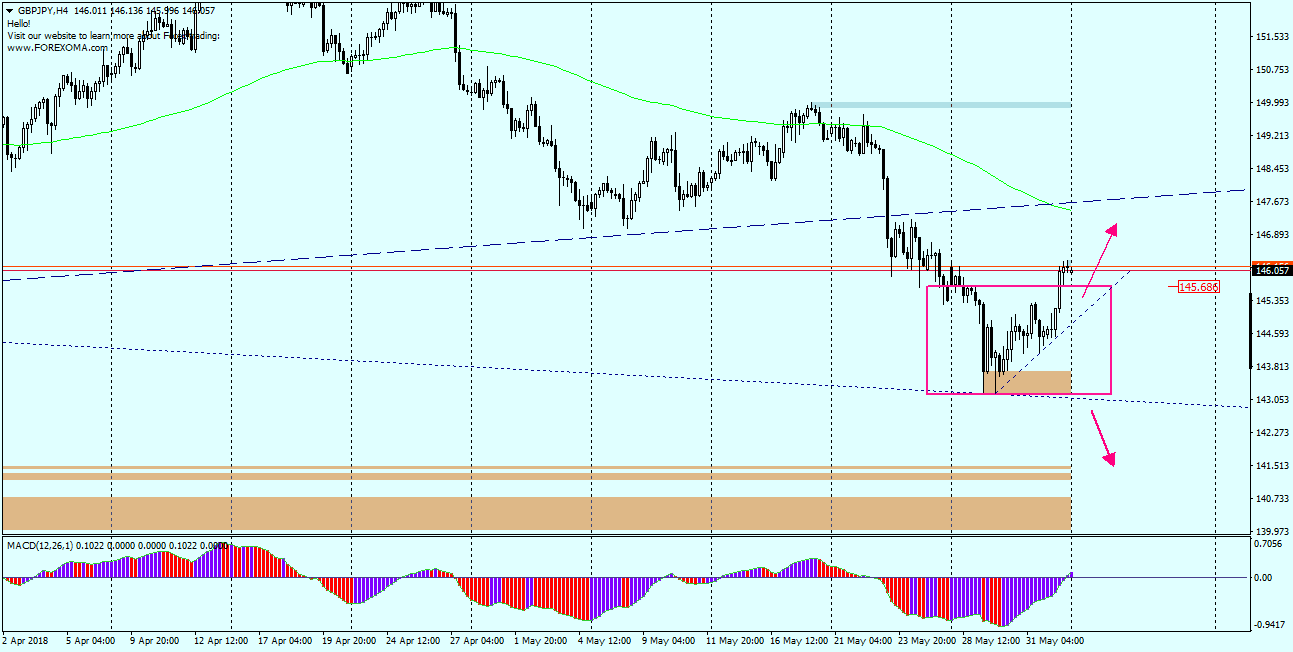
Looking on H4 we can see that in the area of Inside Bar a local upward trend has been created and the support line of this trend may be a good place to decide whether to open a buy order if the price appears there. The lower limit of Inside Bar and at the same time, the minimum of this year, in this case, will be our SL level. It is worth observing this pair this week, perhaps even at the upper limit of IB, you may receive a Price Action signal encouraging you to buy.