The EURJPY pair in the period from May 2020 to May this year moved in a strong uptrend, and since the beginning of 2021 the growth got accelerated and the quotations formed a fairly regular upward channel.
- end of correction?
- inside bar supported by upward divergence
- price near the resistance of the correction channel
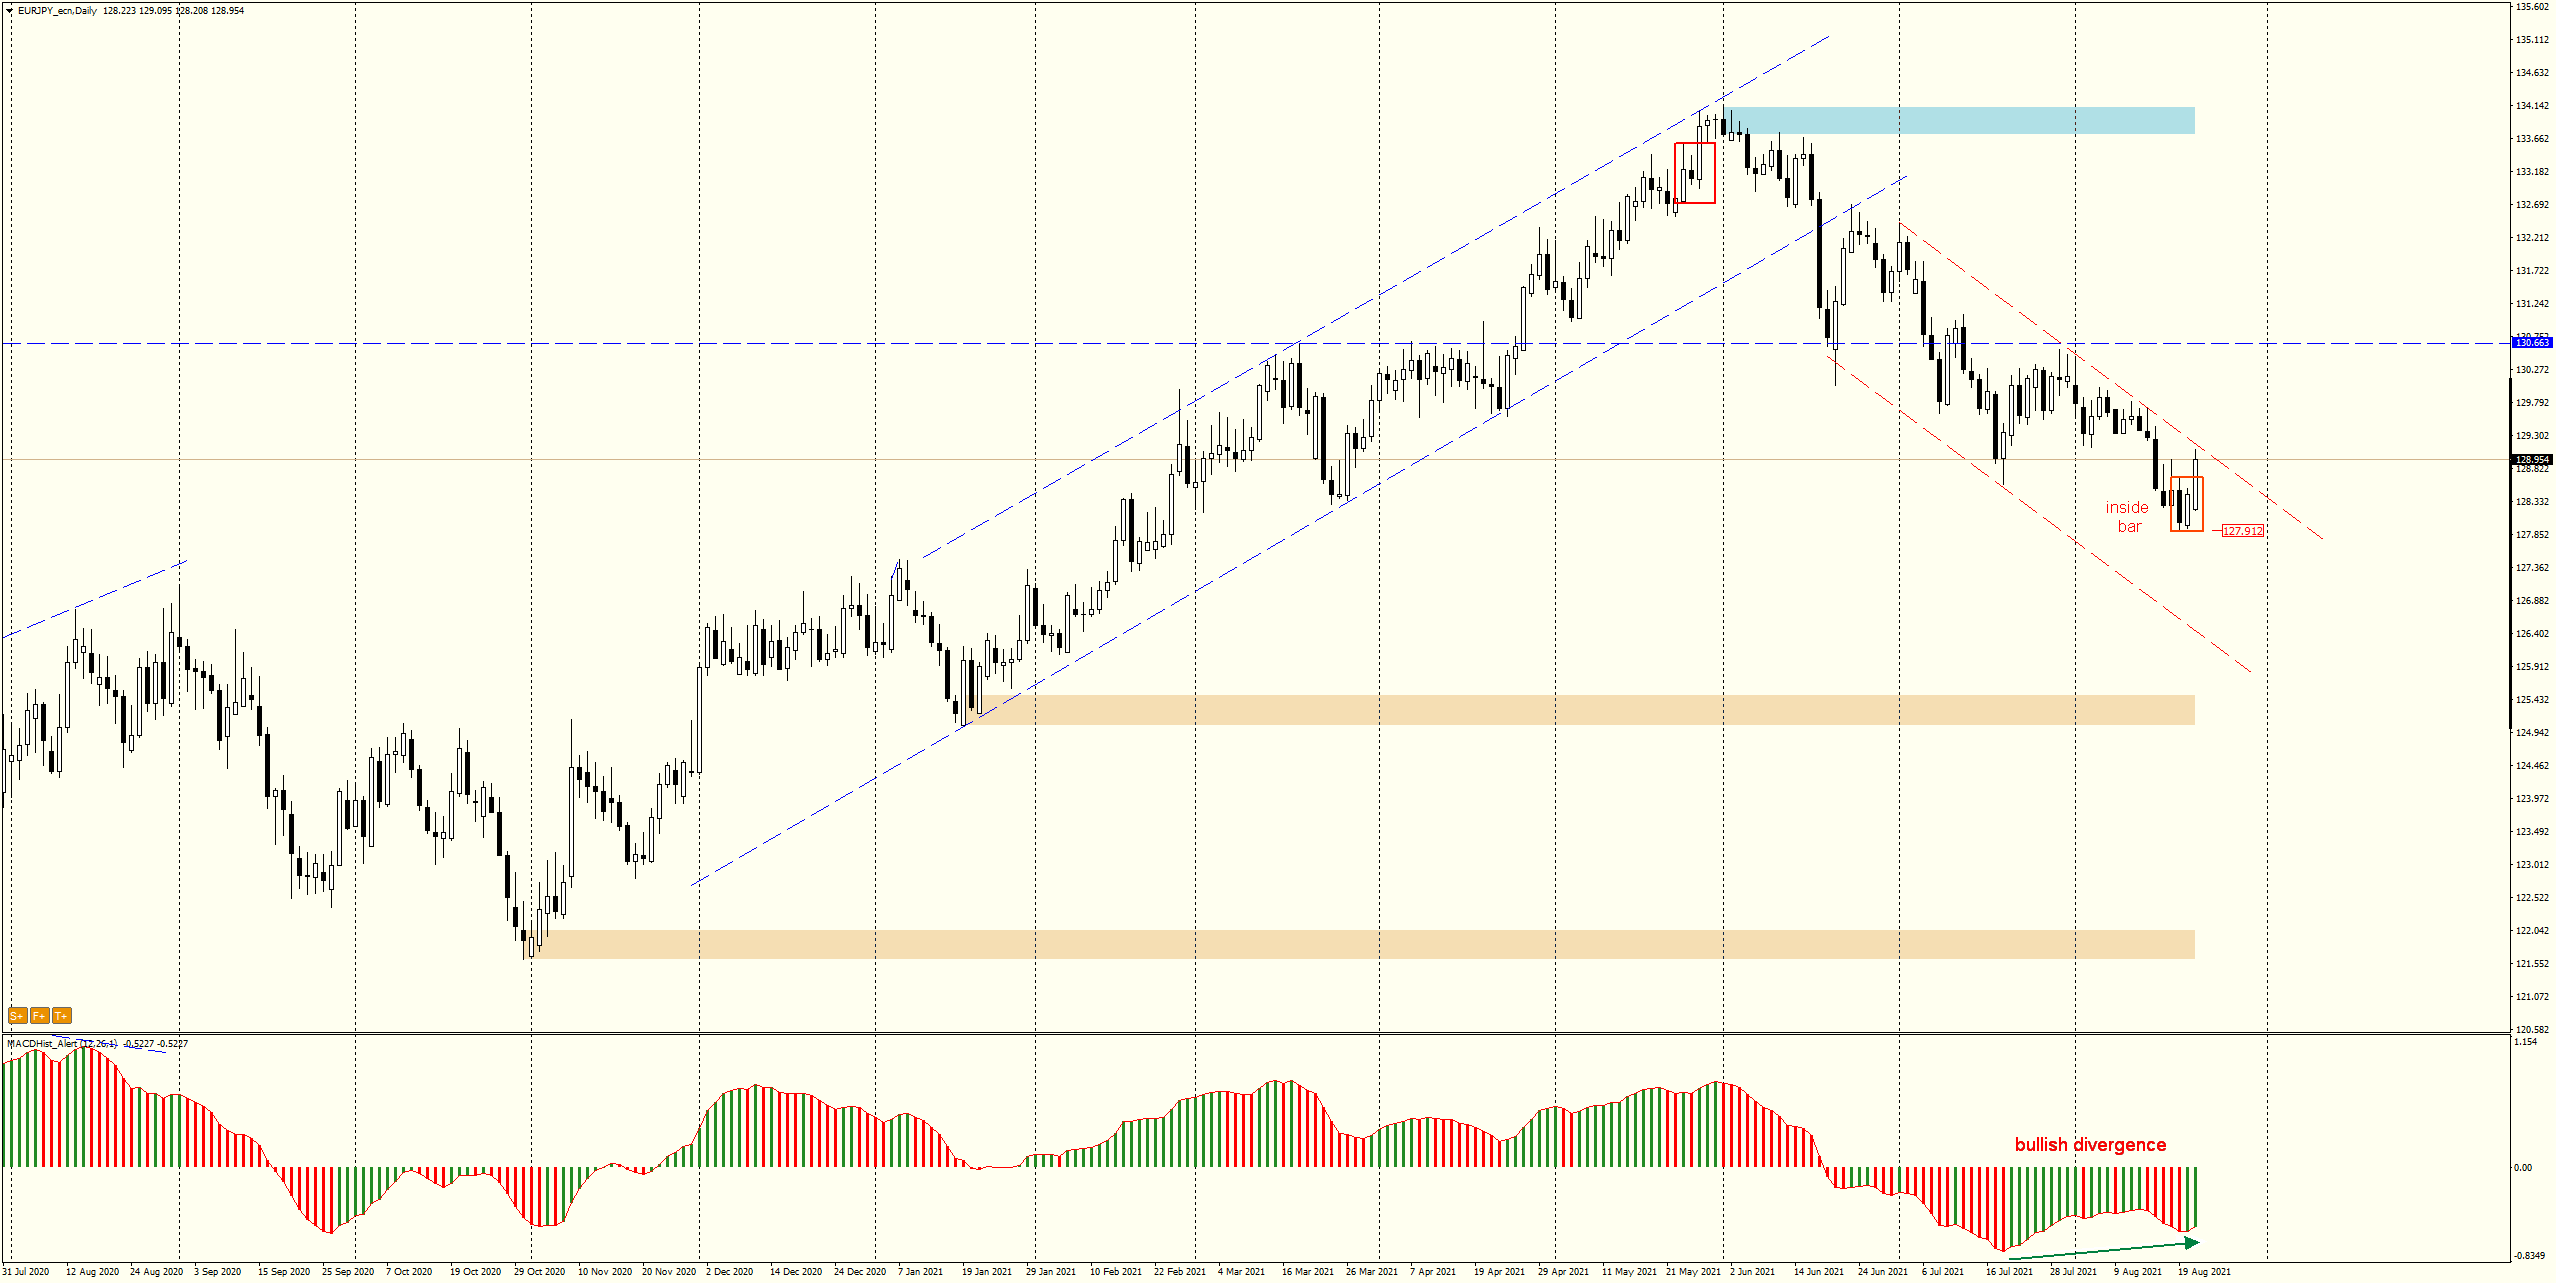
The pair after reaching the maximum of this year at the level of 134.15 began a downward correction and on June 17 this year overcame the support of the mentioned channel. On the daily chart we can see that the last two candles of the past week formed an inside bar formation. Today we observe an upward breakout. An upward divergence appeared on the MACD.
For those using fibonacci levels – the minimum of the mother candle inside bar is located at 50% of the last upward impulse.
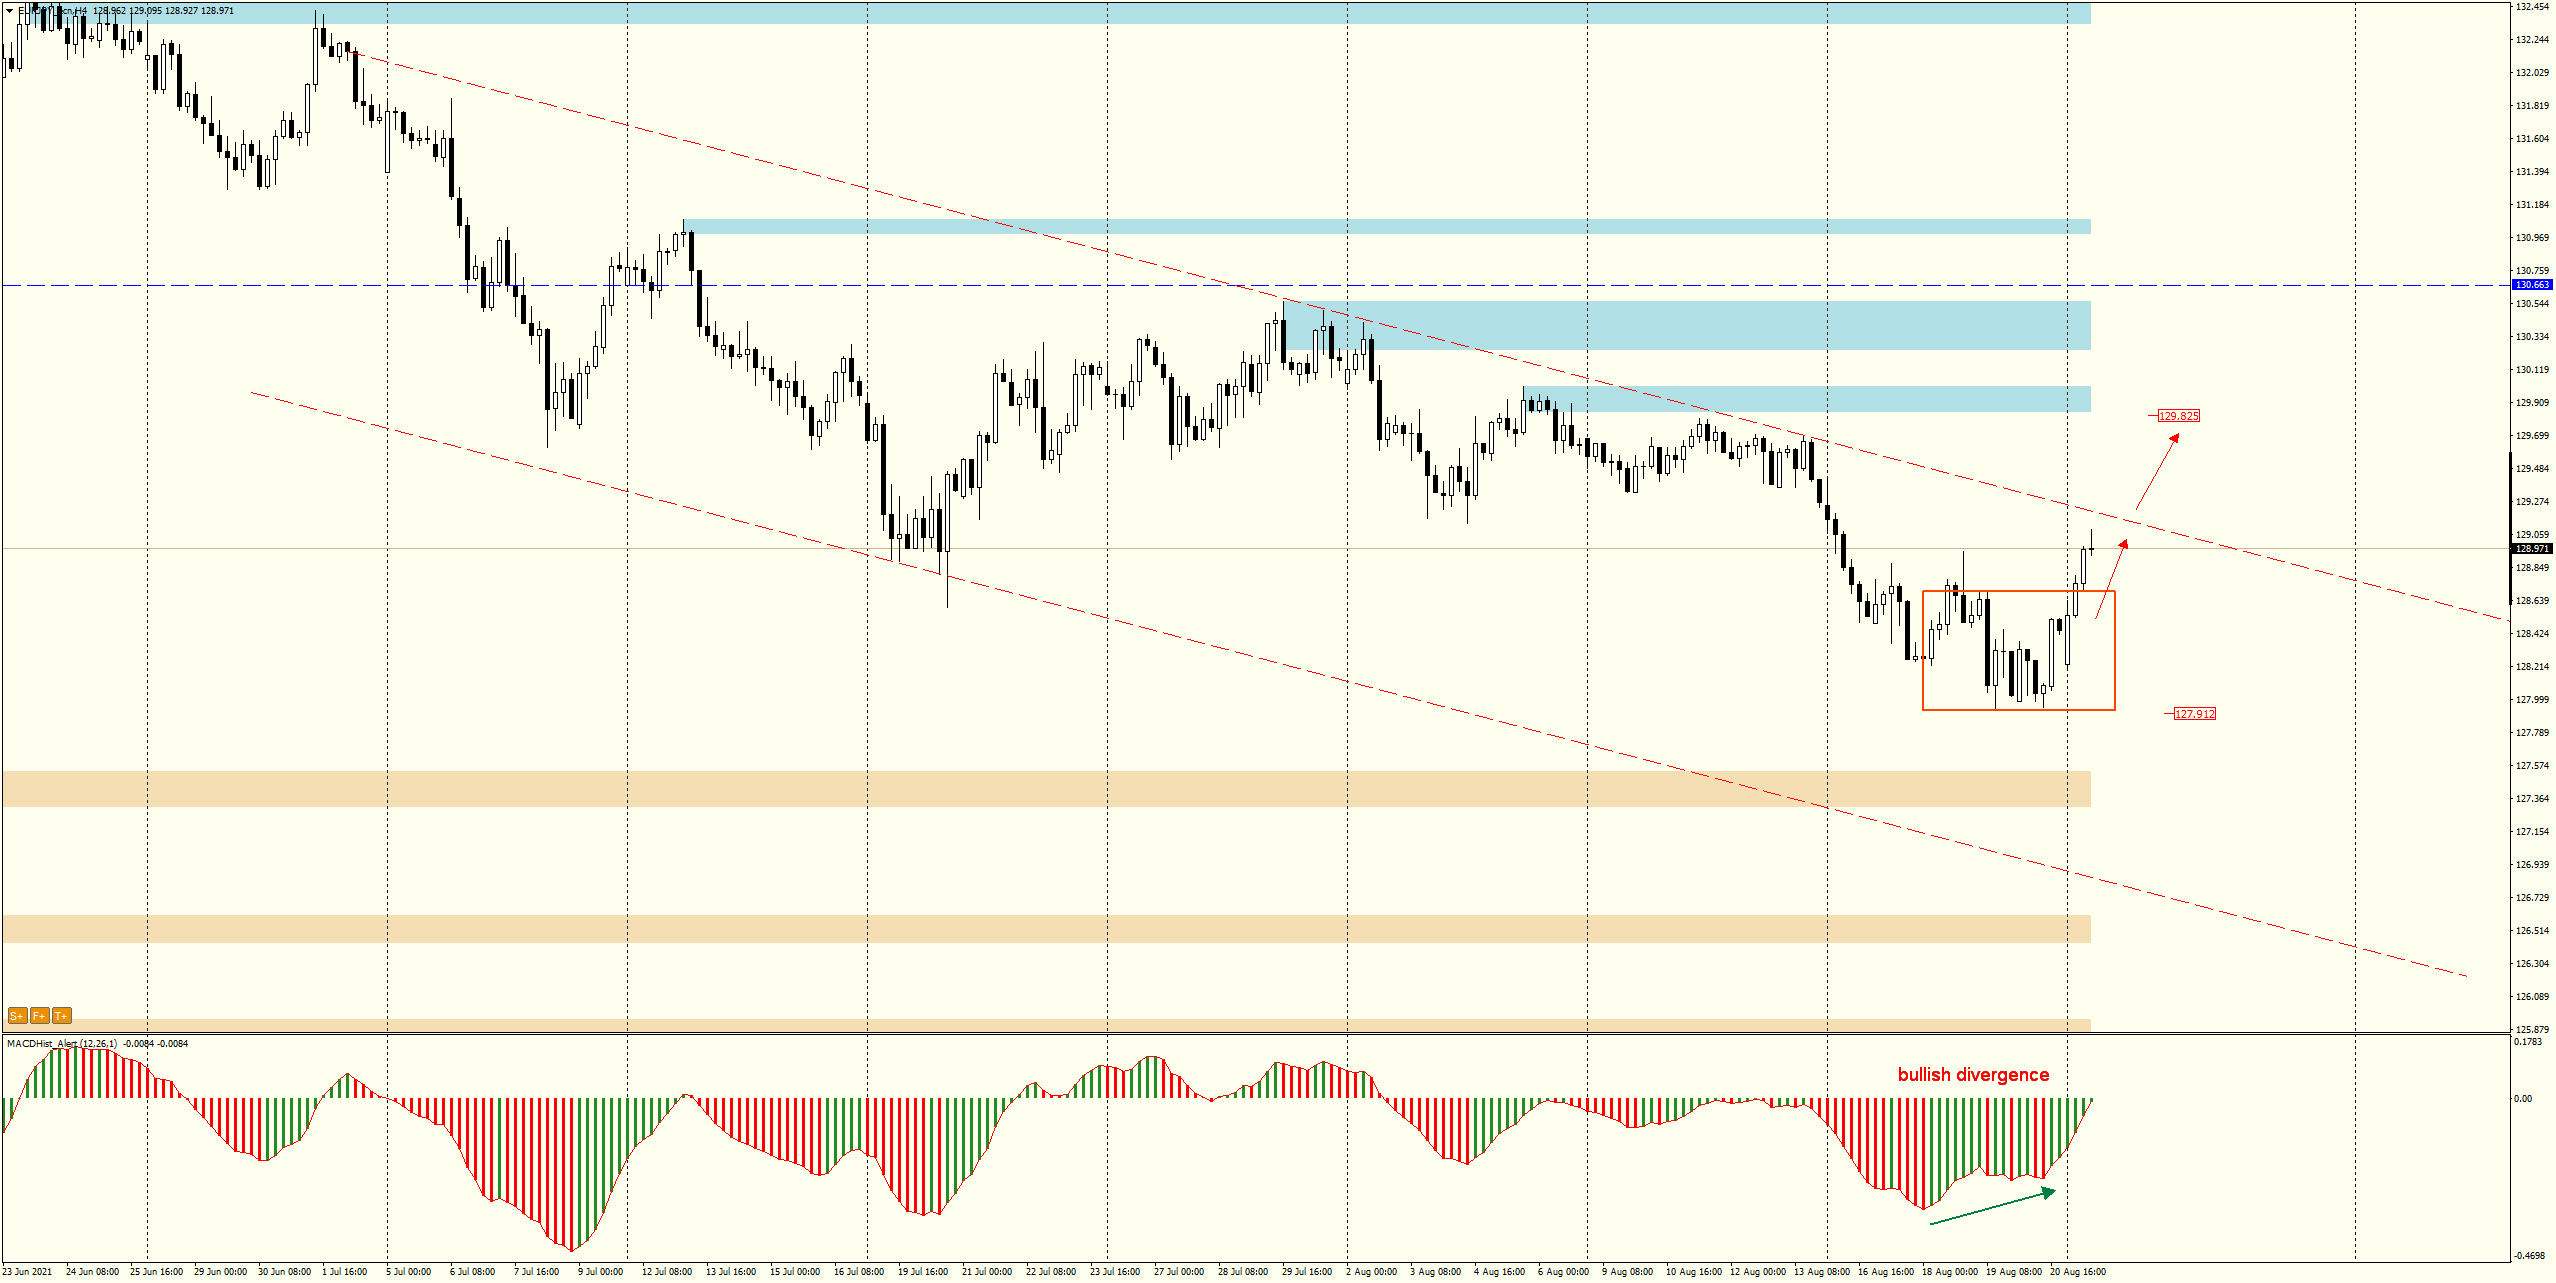
When we look at the H4 chart – here also the upward divergence continues. If the price overcomes the resistance of the downtrend channel (red line ) then it seems that the increases will continue to the nearest supply zone starting at 129.80.
The upward scenario may be negated if the price returns below the minimum of the candle forming the inside bar – 127.90.
By the way, I invite you to a live trading session :
Tuesday 24.08 at 08:00 GMT+1. Free entry here: Live Trading
I recommend a description of the strategy used for this analysis:
ongoing analysis https://t.me/TradewithDargo
 In our Facebook group, which you can join anytime: https://www.facebook.com/groups/328412937935363/ you will find 5 simple strategies on which my trading is based. There, every day we post fresh analyses of currency pairs and commodities. You can also visit my channel where I post my trading ideas: https://t.me/TradewithDargo


 Review")


