 Trading Inside Bars –under this heading you will find analysis made on basis of one of the most known Price Action formation – Inside Bar. Statistics show that best results gives breakout from Inside Bar formation on Daily chart, so mainly this time frame charts will be analysed.
GBPJPY is moving from October 2016 in a consolidation, which took the form of an ascending triangle. Since June 12, there has been a strong bullish movement after reflection from the triangle lower limitation.
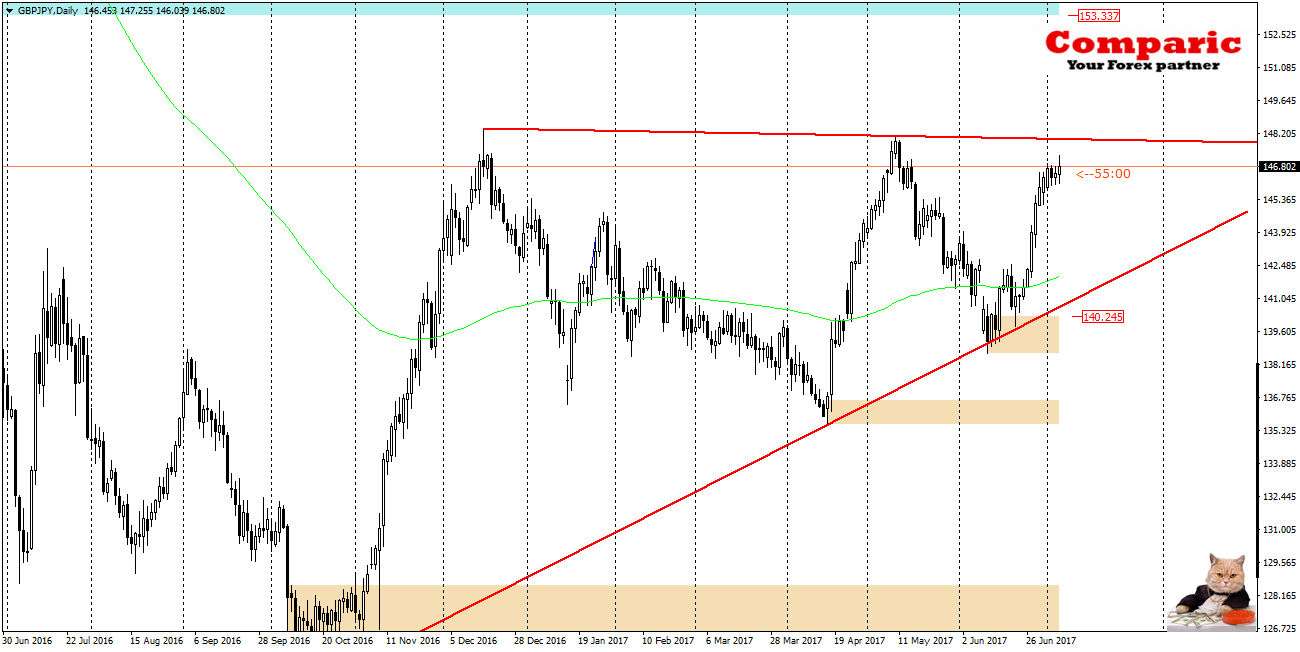
Price has already approached to the upper limit of formation and moves in a Inside Bar created by the Monday day candle. If IB will be broken thru the top in accordance with trend, then we can expect the price to reach the upper limit of the triangle (red line) giving us opportunity to earn 100p on BUY order. Successful breaking the triangle may be a signal for further growth, even up to 153.30 in long run.
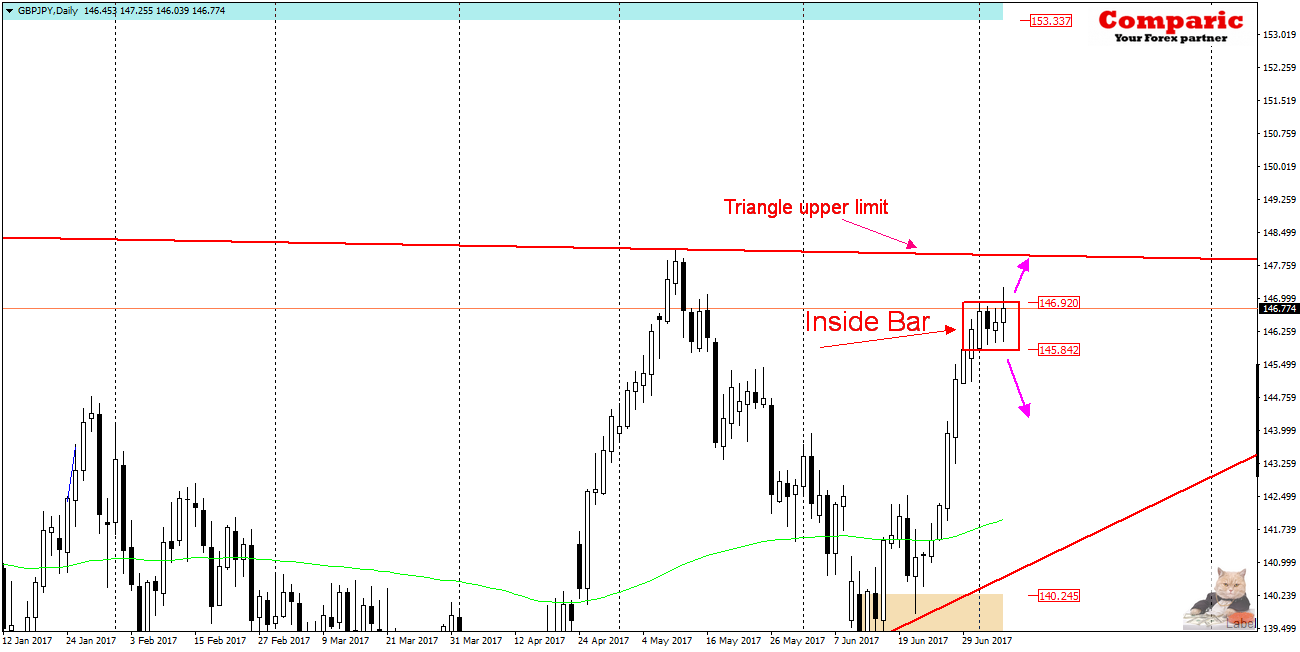
However, if the breakout from Inside Bar is down, declines may stop on the closest support – 145.40 and only after it has been beaten may the downtrend continue to the next support level around 143.80.


 Review")


