Since the beginning of this year, the USDJPY currency pair has been moving in an uptrend in the form of an upward channel.
- July maximum started declines on USDJPY
- inside bar after the downward breakout from the channel
- US inflation data at 14:30
At the beginning of July, the pair established the maximum at the level of 111.66, at the same time forming an engulfing formation and the price began to fall.
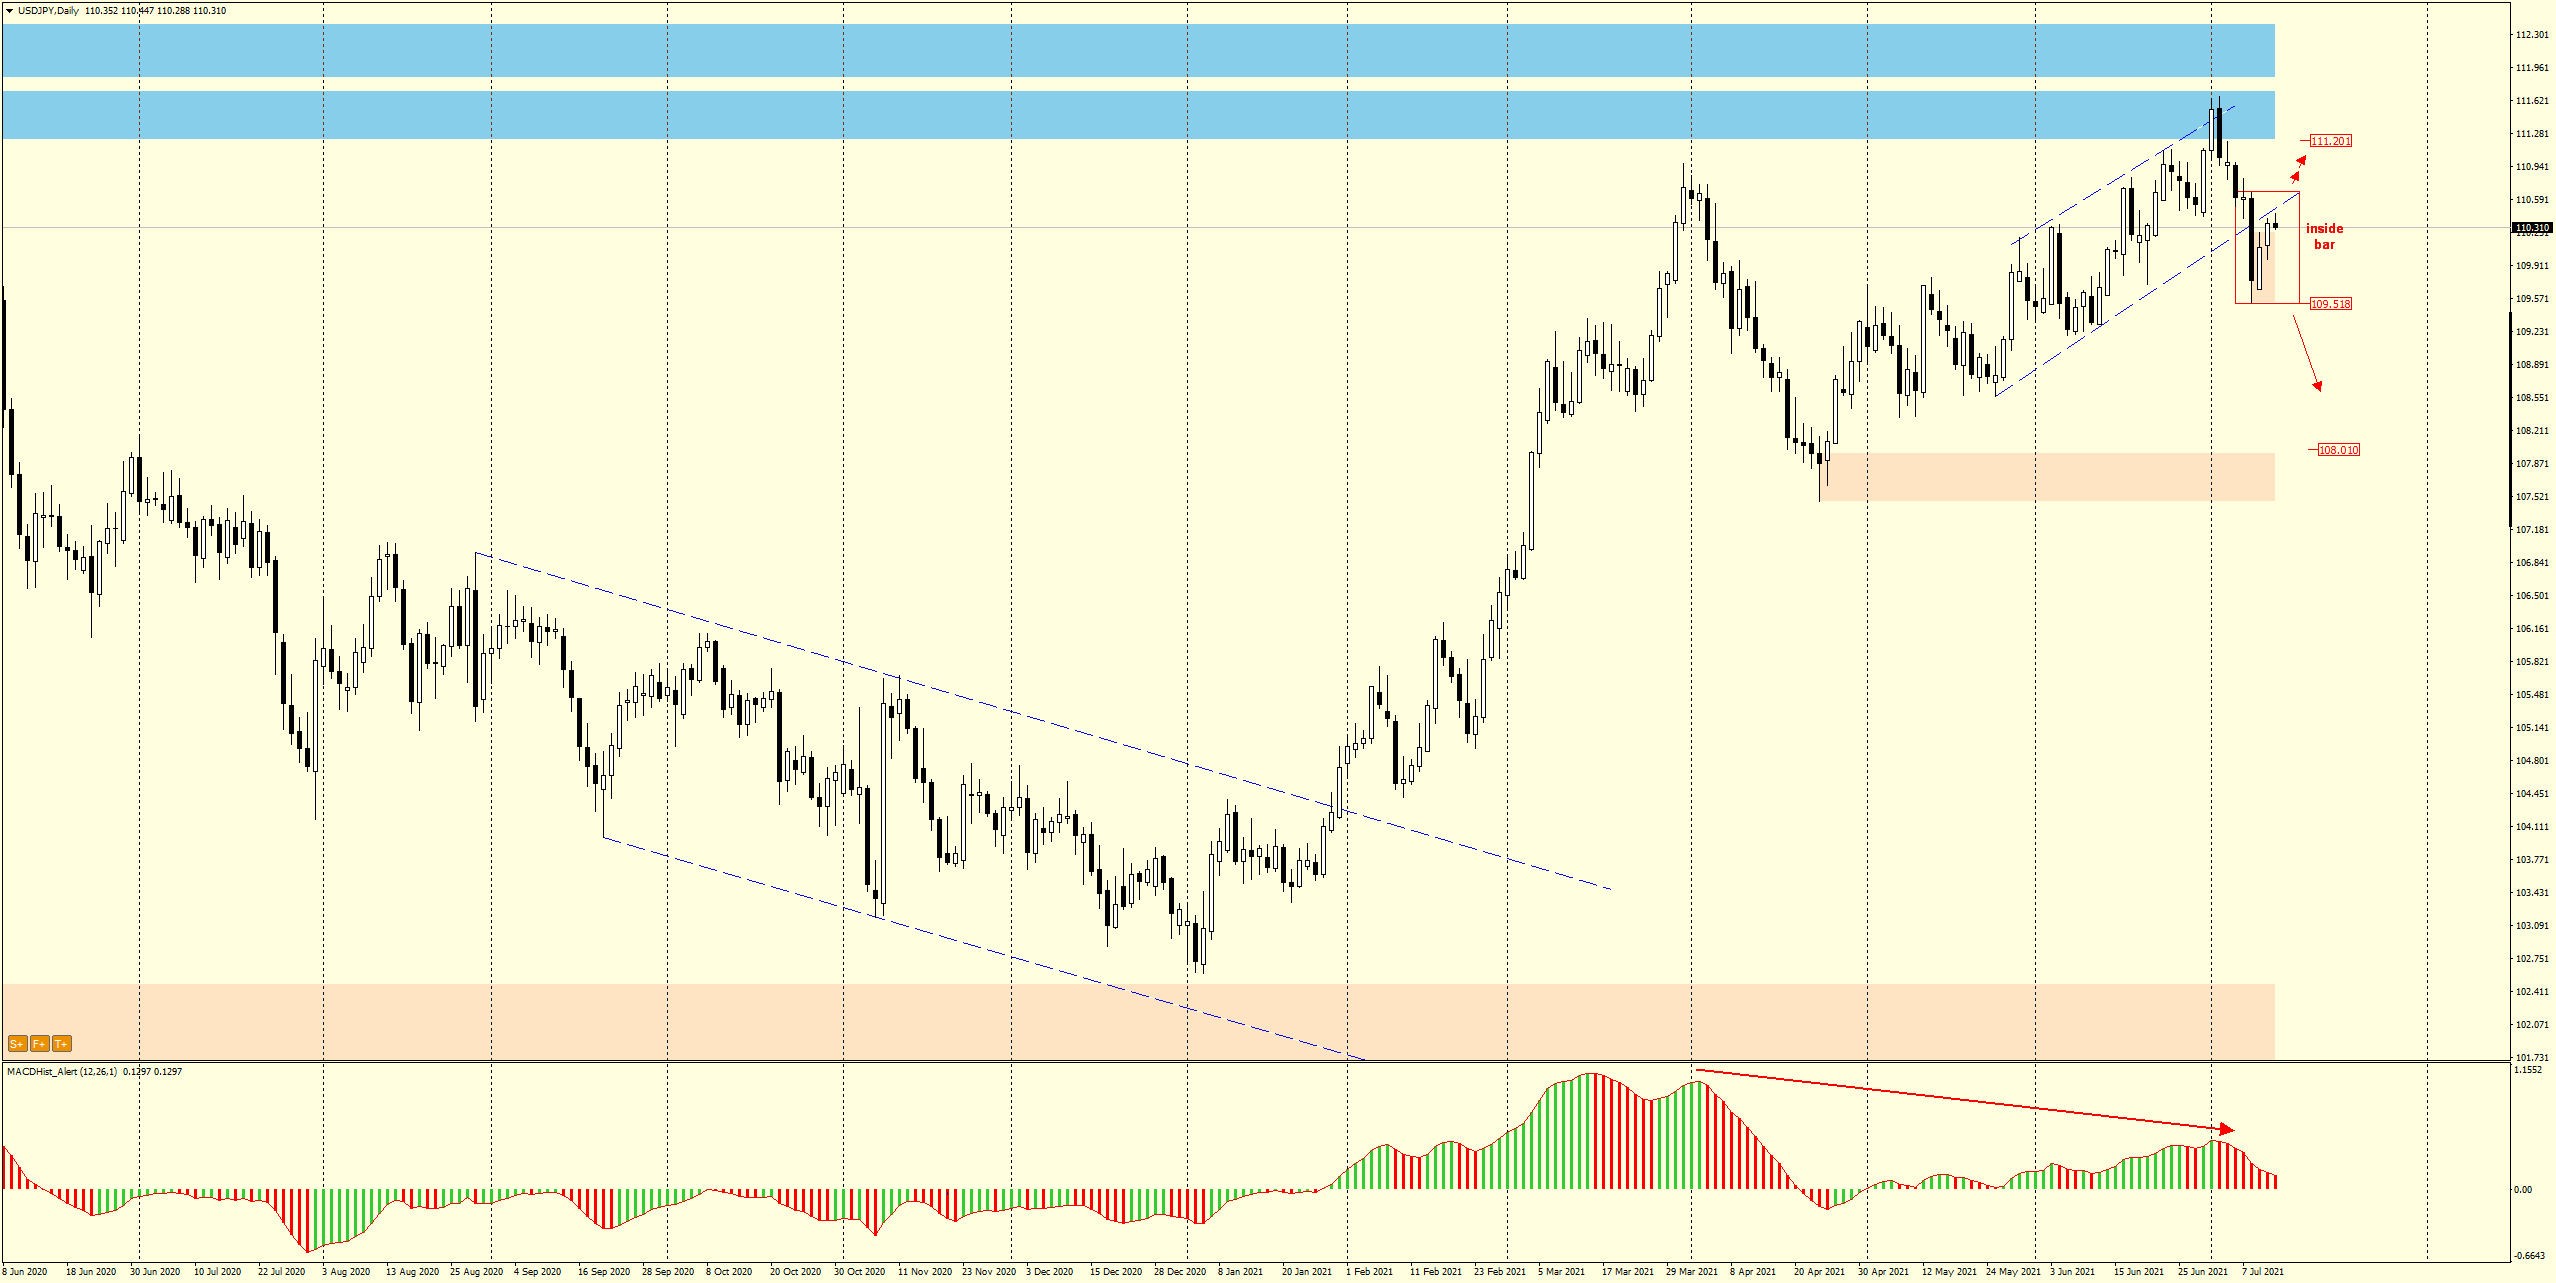
Last Thursday, the price broke out of the channel with a significant 115p day candle.
Currently, the price is approaching the defeated support from the bottom within the range of Thursday’s candle, forming an inside bar formation.
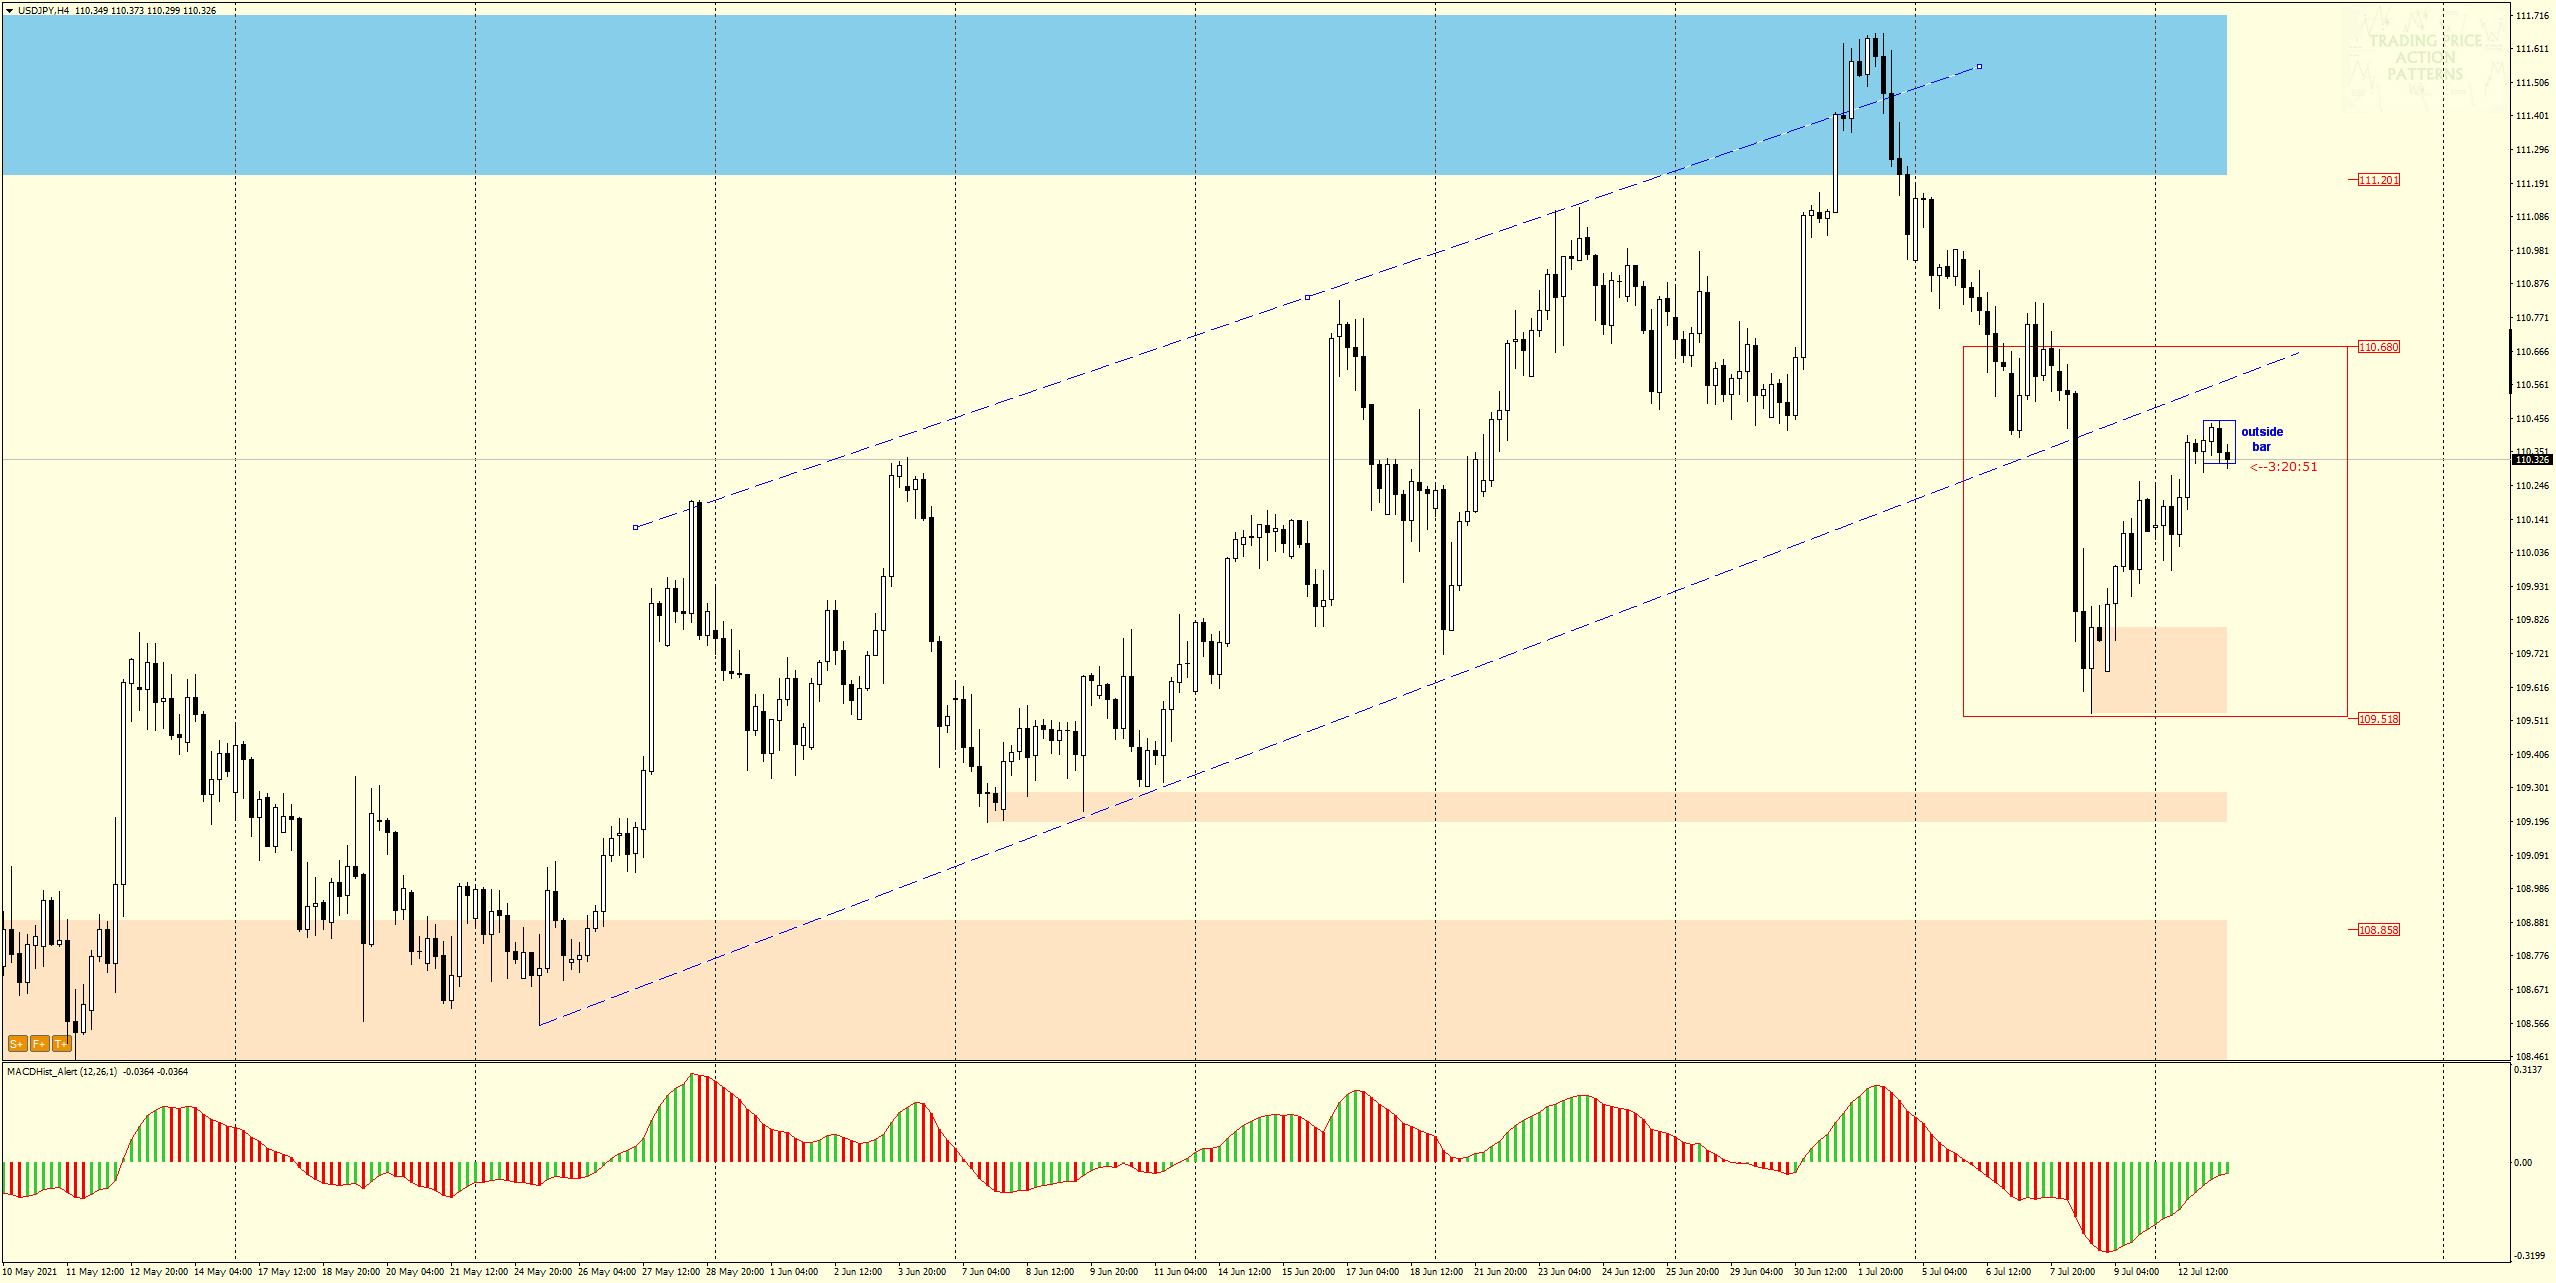
If we look at the H4 chart – we can see that today there was a formation of bearish engulfing (blue rectangle), also called a bearish outside bar. If the downward breakout occurs and the MACD enters a declining phase, it would be a signal for the continuation of the downward correction initiated last Thursday by the aforementioned strong breakout from the channel.
Today at 14:30 we will learn the level of inflation in the USA. These data may lead to increased volatility in gold, JPY, CHF , EUR – therefore it is worth to be cautious in making trading decisions.
By the way, I invite you to an hour-long live trading session Tomorrow, 14.07 at 13:00 GMT+1. Free admission, registration here: TRADING ROOM
I recommend description of the strategy used for this analysis:
ongoing analysis https://t.me/TradewithDargo
 In our Facebook group, which you can join anytime: https://www.facebook.com/groups/328412937935363/ you will find 5 simple strategies on which my trading is based. There, every day we post fresh analyses of currency pairs and commodities. You can also visit my channel where I post my trading ideas: https://t.me/TradewithDargo


 Review")


